Full Report
The numbers behind PT Sarana Menara Nusantara Tbk.: as-reported financial statements and company metrics for FY2022–FY2025, traced to the source filings, opened with the share-price history those statements have to justify. Every linked figure opens the exact page of the filing it was printed on, with the statement row highlighted. Amounts in Rp millions unless noted.
Reading notes: All figures are consolidated and expressed in millions of Indonesian Rupiah (Rp millions), exactly as printed in the audited statements (Indonesian thousands separators converted to plain integers). Main-column citations: FY2025 FY2024 from the FY2025 audited consolidated financial statements (filed as the Q4/FY2025 results book); FY2023 FY2022 from the FY2023 Annual Report (own year + comparative column). Revenue-by-type labels are taken verbatim from each source: the FY2025 book prints 'Lease income'; the FY2023 report prints 'Rental income' (same line, Pendapatan sewa). FY2021 long-term revenue (Rp8,635,300m) and net income (Rp3,447,900m) are taken from the FY2023 Annual Report financial highlights (stated in Rp billion, rounded) and are shown without page links; the FY2021→FY2022 step-up reflects the 2021 Solusi Tunas Pratama (STP) acquisition.
Share Price — Available History Since January 2026
The stock closed at IDR 414.00 on Jul 23, 2026 — down 34% over the window shown, trading between IDR 316.00 and IDR 625.00. At that close the stock trades at 6.0× FY2025 diluted EPS as reported below.
Source: market price feed, daily closes, Jan 2026–Jul 2026 — the feed marks this available history as partial. Price return only, excludes dividends.
FY2025 at a Glance
Revenue (Rp millions)
Operating income (Rp millions)
Net income (Rp millions)
Diluted EPS
Source: FY2025 consolidated statements [1] [2] [3]. Click any linked figure to open the filing page with the row highlighted.
Revenue by Type
| Revenue by Type | FY2022 | FY2023 | FY2024 | FY2025 |
|---|---|---|---|---|
| Lease income (third parties) | 10,210,361 | 10,533,037 | 11,473,707 | 11,671,297 |
| Services and others (third parties) | 684,661 | 1,042,286 | 1,119,642 | 1,483,469 |
| Sub-total (third parties) | 10,895,022 | 11,575,323 | 12,593,349 | 13,154,766 |
| Lease income (related parties) | 1,957 | 1,010 | 3,148 | 3,137 |
| Services and others (related parties) | 138,671 | 164,012 | 139,318 | 170,004 |
| Sub-total (related parties) | 140,628 | 165,022 | 142,466 | 173,141 |
| Total revenues | 11,035,650 | 11,740,345 | 12,735,815 | 13,327,907 |
| Total revenues growth, derived | — | +6.4% | +8.5% | +4.6% |
Source: Note 31/30 Revenues — lease income vs services and others (third and related parties) [4] [5]. Click any linked figure to open the filing page with the row highlighted.
Income Statement
Source: Consolidated Statement of Profit or Loss and Other Comprehensive Income [1] [2] [3]. Click any linked figure to open the filing page with the row highlighted.
Columns marked E are consensus analyst estimates from S&P Capital IQ (CapIQ), shown alongside reported results for direct comparison; they are not company guidance.
Estimate source: S&P Capital IQ (CapIQ) consensus, as of 2026-07-23. Estimate figures are S&P Capital IQ consensus (vendor data — no filing page links). EPS and net income use the normalized (adjusted) consensus where the street reports it. Consensus revenue sits well below the as-reported line for the last actual year — analysts often model a narrower revenue basis (e.g. net of interest or pass-through costs), so compare trends, not levels. Line-item analyst models (segments, drivers, KPIs) are in the Visible Alpha tab.
Balance Sheet
Source: Consolidated Statement of Financial Position [6] [7] [8] [9]. Click any linked figure to open the filing page with the row highlighted.
Cash Flow
| Cash Flow | FY2022 | FY2023 | FY2024 | FY2025 |
|---|---|---|---|---|
| Net cash flows provided by operating activities | 8,072,991 | 8,915,256 | 9,340,067 | 10,354,694 |
| Payments for acquisition of fixed assets and advance for suppliers | (4,681,060) | (4,563,727) | (4,519,034) | (3,287,492) |
| Acquisition of businesses, net of cash acquired | (1,139,222) | (42,701) | (3,457,027) | 6,163 |
| Net cash flows used in investing activities | (5,887,863) | (4,546,860) | (8,005,524) | (3,479,241) |
| Payments of dividends - owners of the parent entity | (1,202,174) | (1,201,303) | (901,363) | (1,192,355) |
| Payments for lease liabilities | (1,301,789) | (1,674,830) | (1,650,645) | (1,257,762) |
| Proceed from shares issuance | — | — | — | 5,496,766 |
| Net cash flows used in financing activities | (6,709,726) | (4,246,921) | (783,037) | (7,161,958) |
| Net increase (decrease) in cash and cash equivalents | (4,524,598) | 121,475 | 551,506 | (286,505) |
Source: Consolidated Statement of Cash Flows [10] [11] [12] [13]. Click any linked figure to open the filing page with the row highlighted.
Tower Portfolio Operations
| Tower Portfolio Operations | FY2022 | FY2023 | FY2024 | FY2025 |
|---|---|---|---|---|
| Total towers | 29,794 | 30,558 | 35,400 | 36,247 |
| Total sites (tenancies) | 54,284 | 54,284 | 58,035 | 60,540 |
| Tenancy ratio | — | — | — | 1.7 |
| Tower tenancy revenue | 8,606,000 | 8,346,300 | 8,523,000 | 8,725,600 |
Source: company filings [14] [15] [16]. Click any linked figure to open the filing page with the row highlighted.
Profitability Margins
| Profitability Margins | FY2022 | FY2023 | FY2024 | FY2025 |
|---|---|---|---|---|
| EBITDA | 9,516,600 | 9,979,600 | 10,700,100 | 10,970,500 |
| EBITDA margin | 86.2% | 85.0% | 84.0% | 82.3% |
| Operating income margin | 61.9% | 59.1% | 57.1% | 56.3% |
| Net profit margin | 31.7% | 28.1% | 26.4% | 27.6% |
| Return on equity | 24.2% | 20.0% | 17.6% | 13.6% |
| Return on assets | 5.3% | 4.8% | 4.3% | 4.8% |
Source: company filings [15] [17] [16] [18]. Click any linked figure to open the filing page with the row highlighted.
Leverage Funding
| Leverage Funding | FY2022 | FY2023 | FY2024 | FY2025 |
|---|---|---|---|---|
| Bank loans and bonds payable | 42,994,600 | 44,467,700 | 51,417,400 | 44,553,100 |
| Net debt to equity | 2.9 | 2.7 | 2.6 | 1.6 |
| Net debt to LQA EBITDA | 4.2 | 4.3 | 4.6 | 3.7 |
| Average cost of borrowing | — | — | 6.5% | 6.0% |
Source: company filings [19] [15] [17] [16]. Click any linked figure to open the filing page with the row highlighted.
Fiber Connectivity (2025)
| Fiber Connectivity (2025) | FY2022 | FY2023 | FY2024 | FY2025 |
|---|---|---|---|---|
| Fiber-optic network (incl. associate DATA) | — | — | — | 185,000 |
| FTTH home passes | — | — | — | 2,344,187 |
| FTTH home connections | — | — | — | 390,222 |
| FTTH penetration rate | — | — | — | 16.6% |
Source: company filings [20] [21]. Click any linked figure to open the filing page with the row highlighted.
Long-Term Record
| Fiscal year | Total revenue | Profit for the year | Net cash from operating activities | Capital expenditure | Diluted earnings per share |
|---|---|---|---|---|---|
| FY2016 | — | — | 3,832,865 | (3,866,597) | — |
| FY2017 | — | — | 3,454,291 | (740,751) | — |
| FY2018 | — | — | 3,620,921 | (2,056,963) | — |
| FY2019 | — | — | 3,955,483 | (4,442,048) | — |
| FY2020 | — | — | 5,951,202 | (3,929,140) | — |
| FY2021 | 8,635,300 | 3,447,900 | 6,196,246 | (2,192,540) | — |
| FY2022 | 11,035,650 | 3,496,535 | 8,072,991 | (4,681,060) | 69.00 |
| FY2023 | 11,740,345 | 3,303,642 | 8,915,256 | (4,563,727) | 65.00 |
| FY2024 | 12,735,815 | 3,364,606 | 9,340,067 | (4,519,034) | 67.00 |
| FY2025 | 13,327,907 | 3,682,248 | 10,354,694 | (3,287,492) | 69.00 |
Source: consolidated statements across filings; older years from the standardized feed [11] [1] [2] [13]. Click any linked figure to open the filing page with the row highlighted.
Operating KPIs
| KPI | FY2022 | FY2023 | FY2024 | FY2025 |
|---|---|---|---|---|
| Total towers | — | 30,558 | 35,400 | 36,247 |
| Number of total sites (tenants) | — | 54,284 | 58,035 | 60,540 |
Source: company-reported operating metrics [15]. Click any linked figure to open the filing page with the row highlighted.
Analyst Consensus
Mean target
Median target
High target
Low target
Street ratings: 9 strong buy, 3 buy, 1 hold. Consensus: Strong Buy.
Estimate source: S&P Capital IQ (CapIQ) consensus, as of 2026-07-23. Estimate figures are S&P Capital IQ consensus (vendor data — no filing page links). EPS and net income use the normalized (adjusted) consensus where the street reports it. Consensus revenue sits well below the as-reported line for the last actual year — analysts often model a narrower revenue basis (e.g. net of interest or pass-through costs), so compare trends, not levels. Line-item analyst models (segments, drivers, KPIs) are in the Visible Alpha tab.
Traceability
276 of 290 figures on this page (95%) link to the filing page where they are printed — click a linked figure to open the source PDF at that page with the row highlighted. Unlinked figures come from standardized data feeds or pre-filing years.
All figures are consolidated and expressed in millions of Indonesian Rupiah (Rp millions), exactly as printed in the audited statements (Indonesian thousands separators converted to plain integers).
Main-column citations: FY2025 FY2024 from the FY2025 audited consolidated financial statements (filed as the Q4/FY2025 results book); FY2023 FY2022 from the FY2023 Annual Report (own year + comparative column).
Revenue-by-type labels are taken verbatim from each source: the FY2025 book prints 'Lease income'; the FY2023 report prints 'Rental income' (same line, Pendapatan sewa).
FY2021 long-term revenue (Rp8,635,300m) and net income (Rp3,447,900m) are taken from the FY2023 Annual Report financial highlights (stated in Rp billion, rounded) and are shown without page links; the FY2021→FY2022 step-up reflects the 2021 Solusi Tunas Pratama (STP) acquisition.
Long-term operating cash flow and capital expenditure for FY2016–FY2021 are from the standardized data feed (audited filings not in this run's corpus) and are shown without page links; FY2022–FY2025 are cited to the statements.
Quarterly income is derived from the year-to-date interim statements (TOWR reports interim P L on a cumulative basis); quarterly balance-sheet figures are point-in-time as printed. The 2025 rights issue (Rp5.49tn) is visible in the equity jump between Q2 and Q3 FY25.
1 figure(s) differed between the data feed and the filing; the filing value is shown (see the run's metrics/metrics_tab.json for the audit trail).
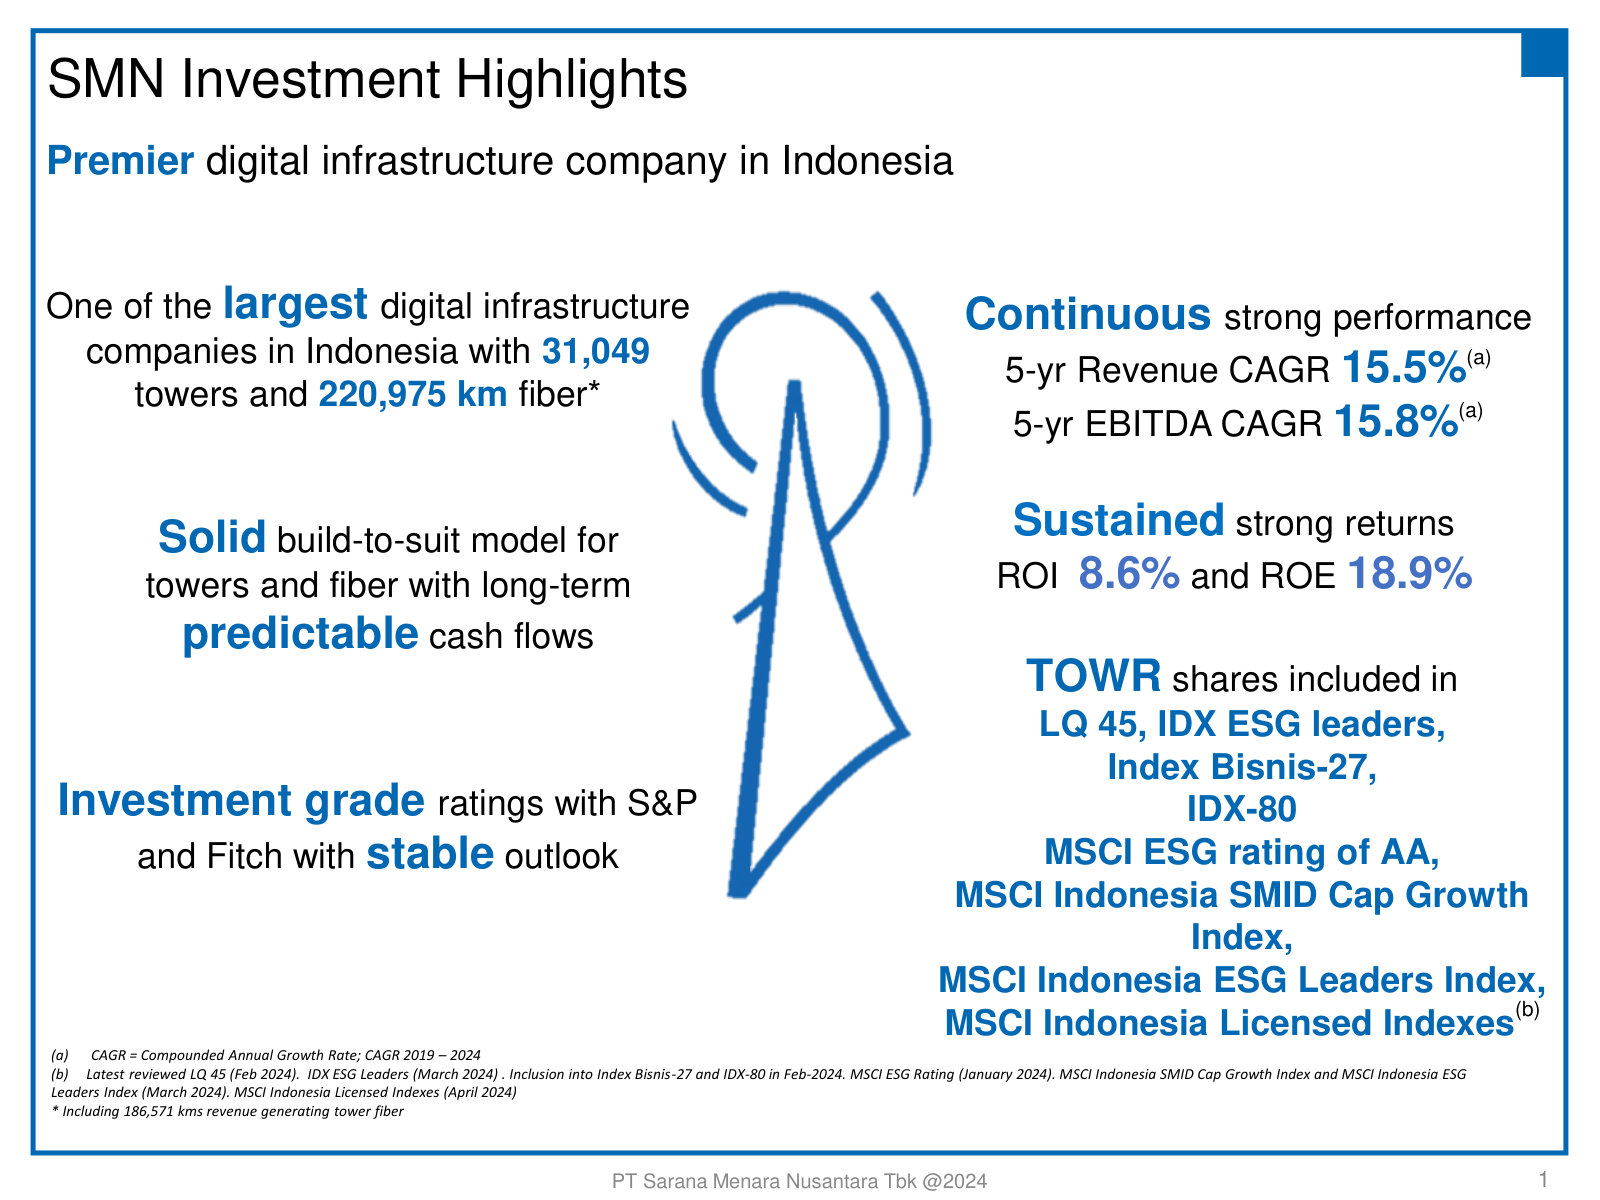
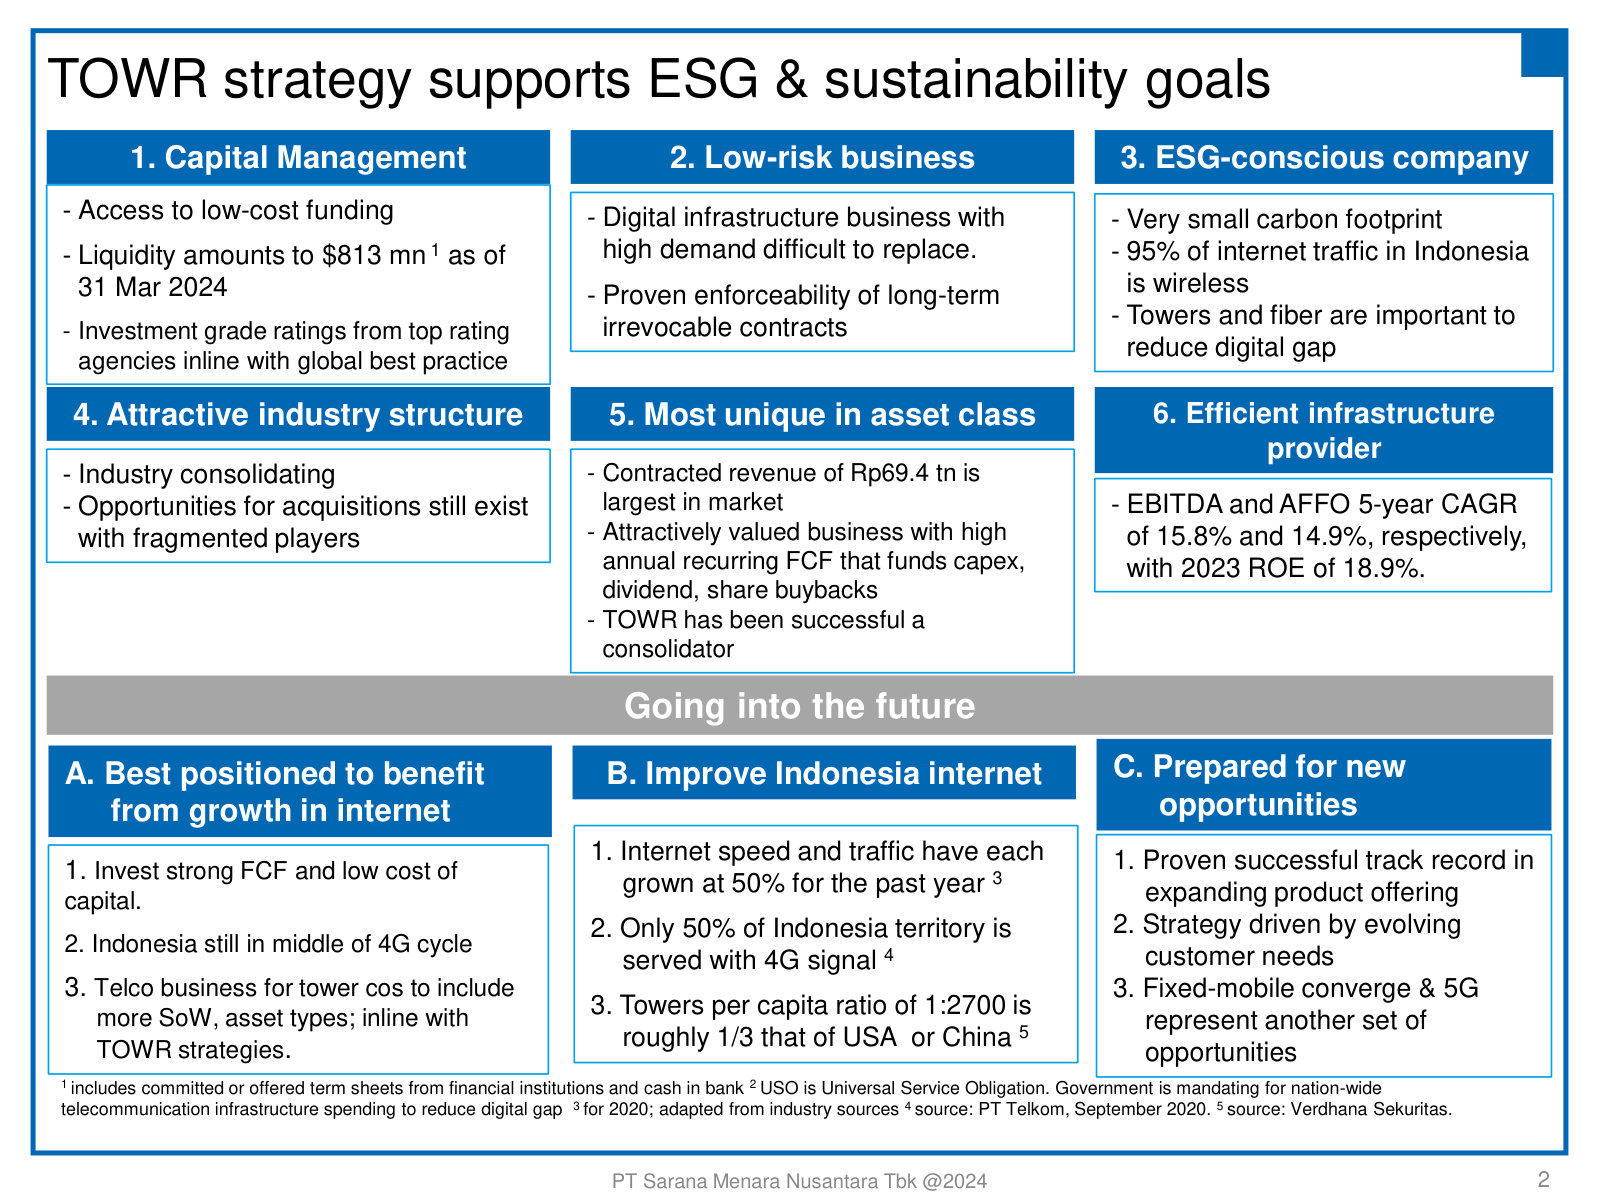
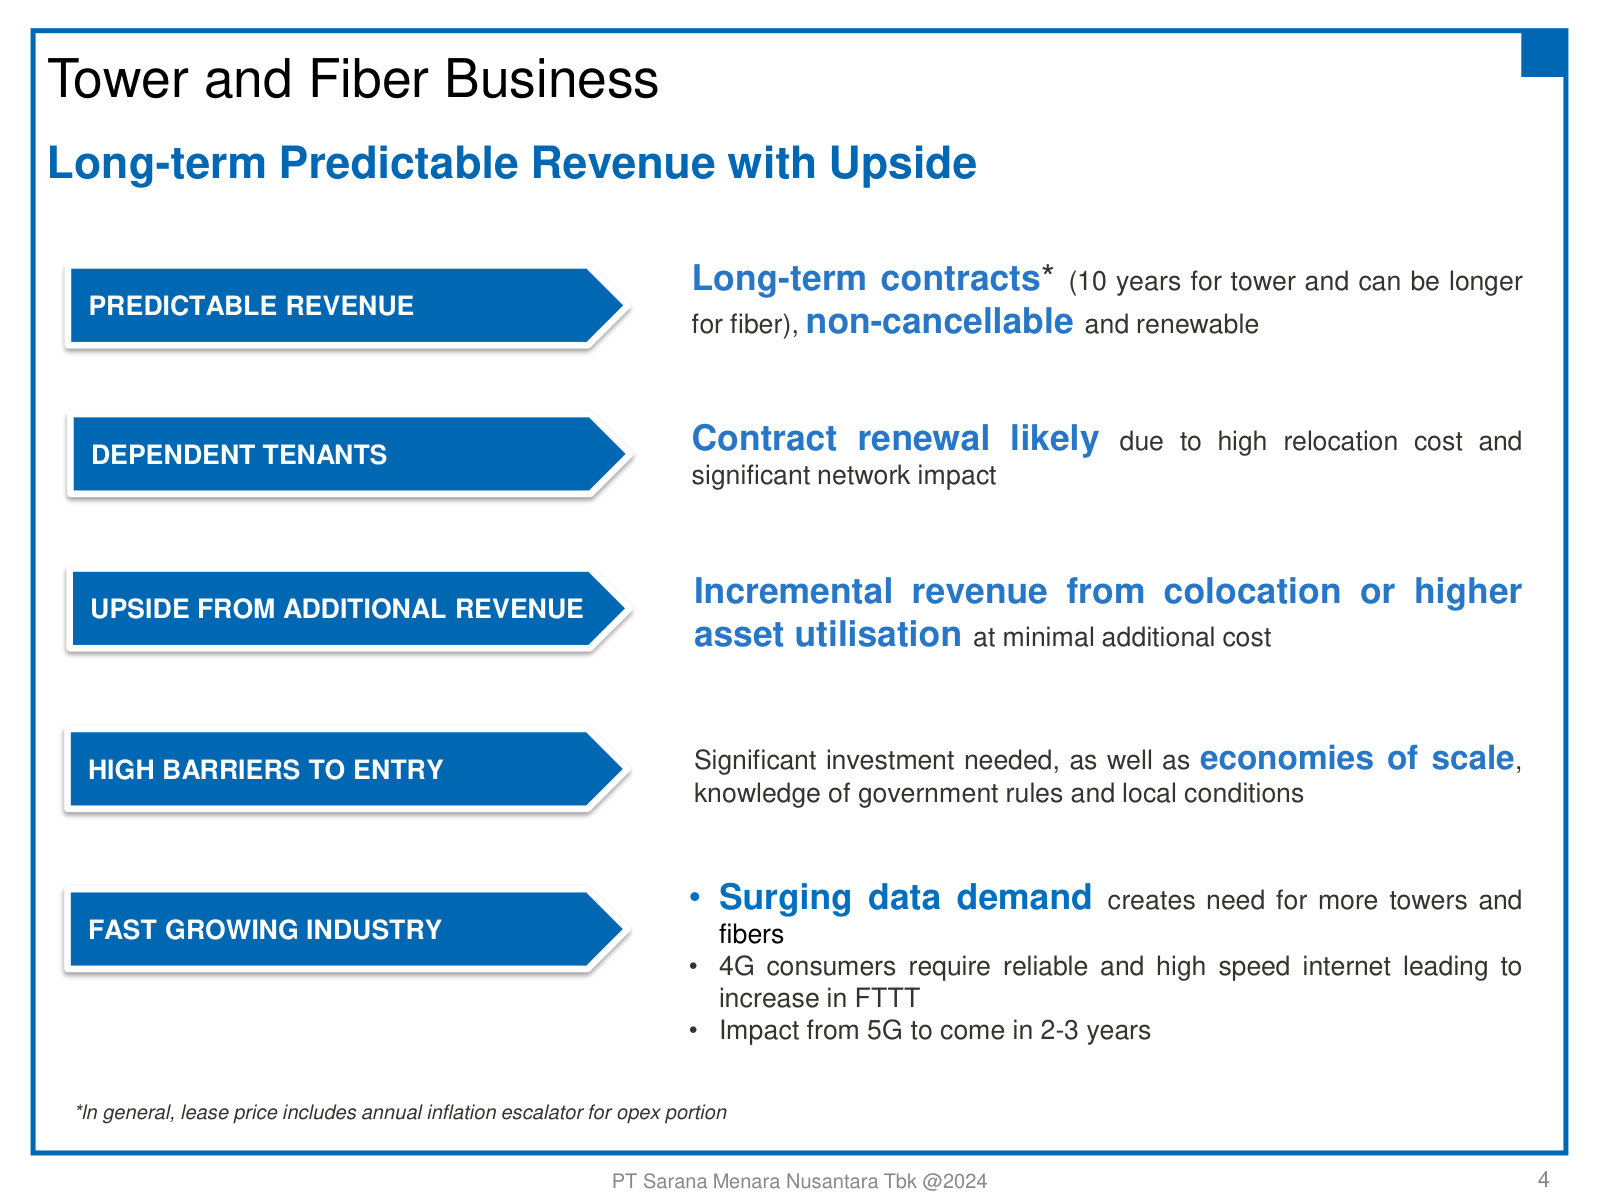
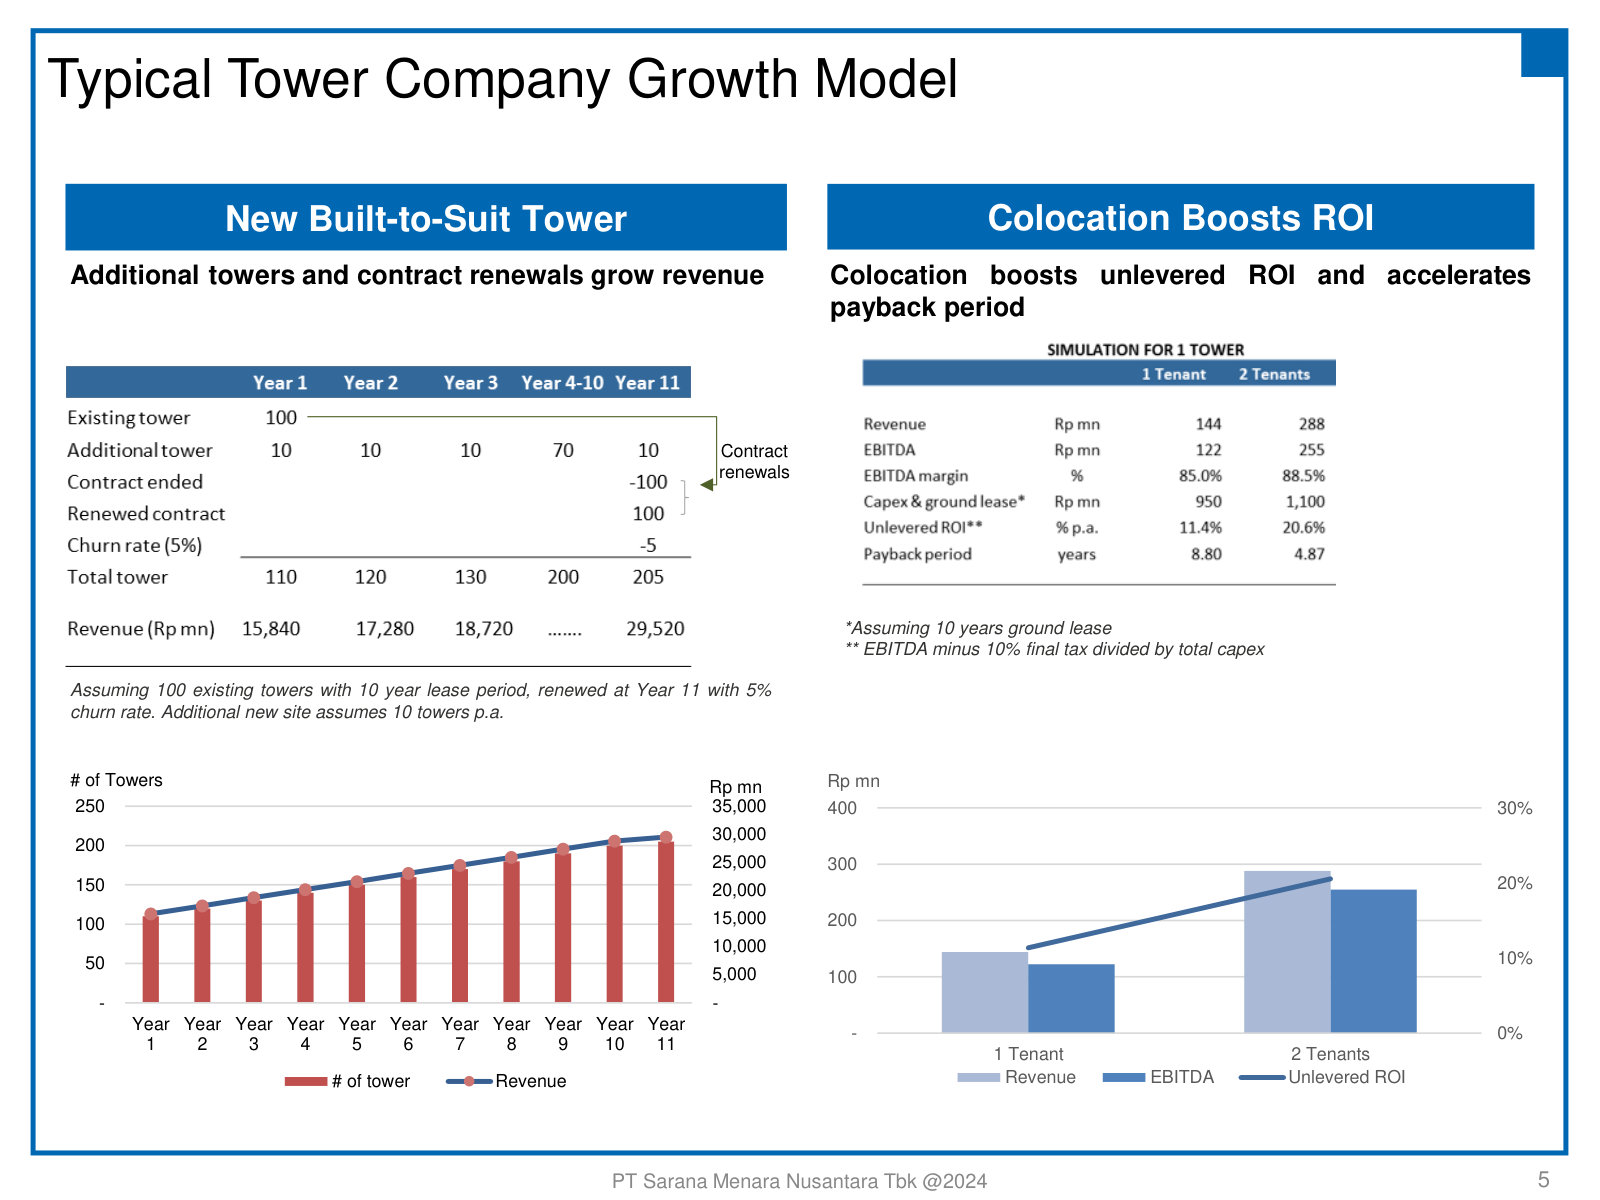
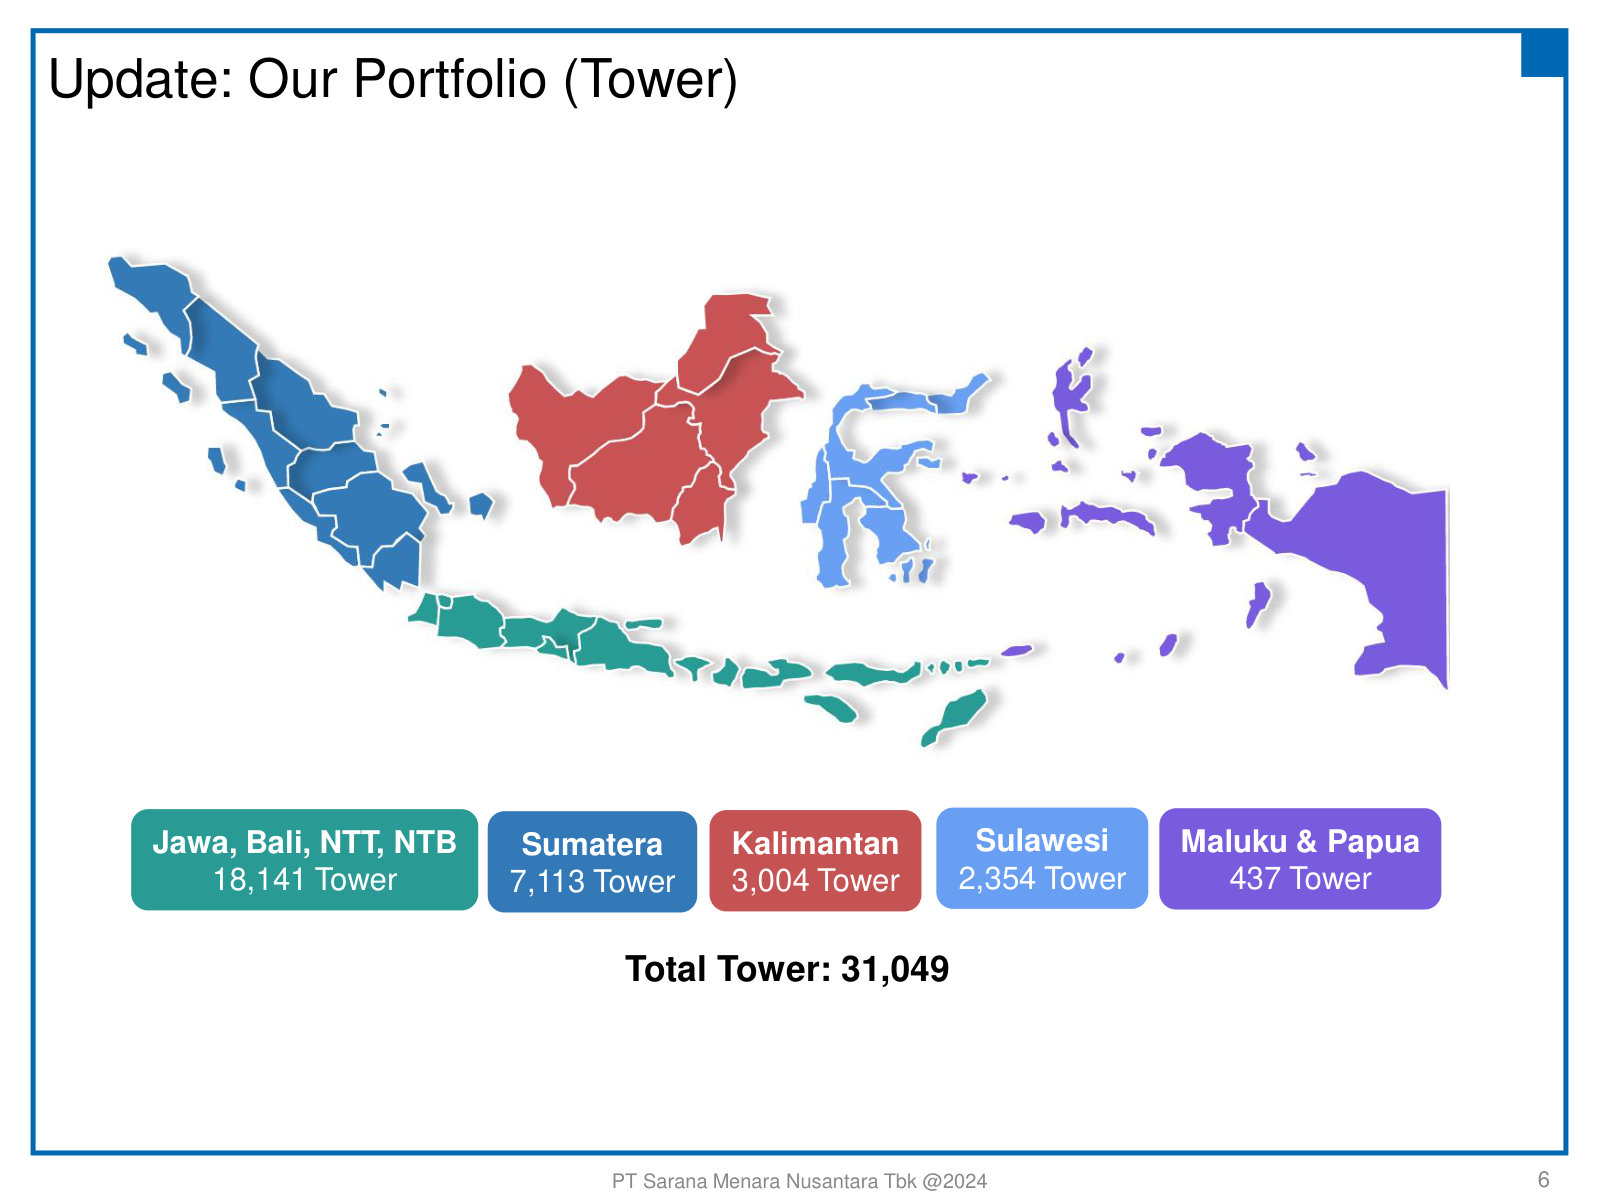
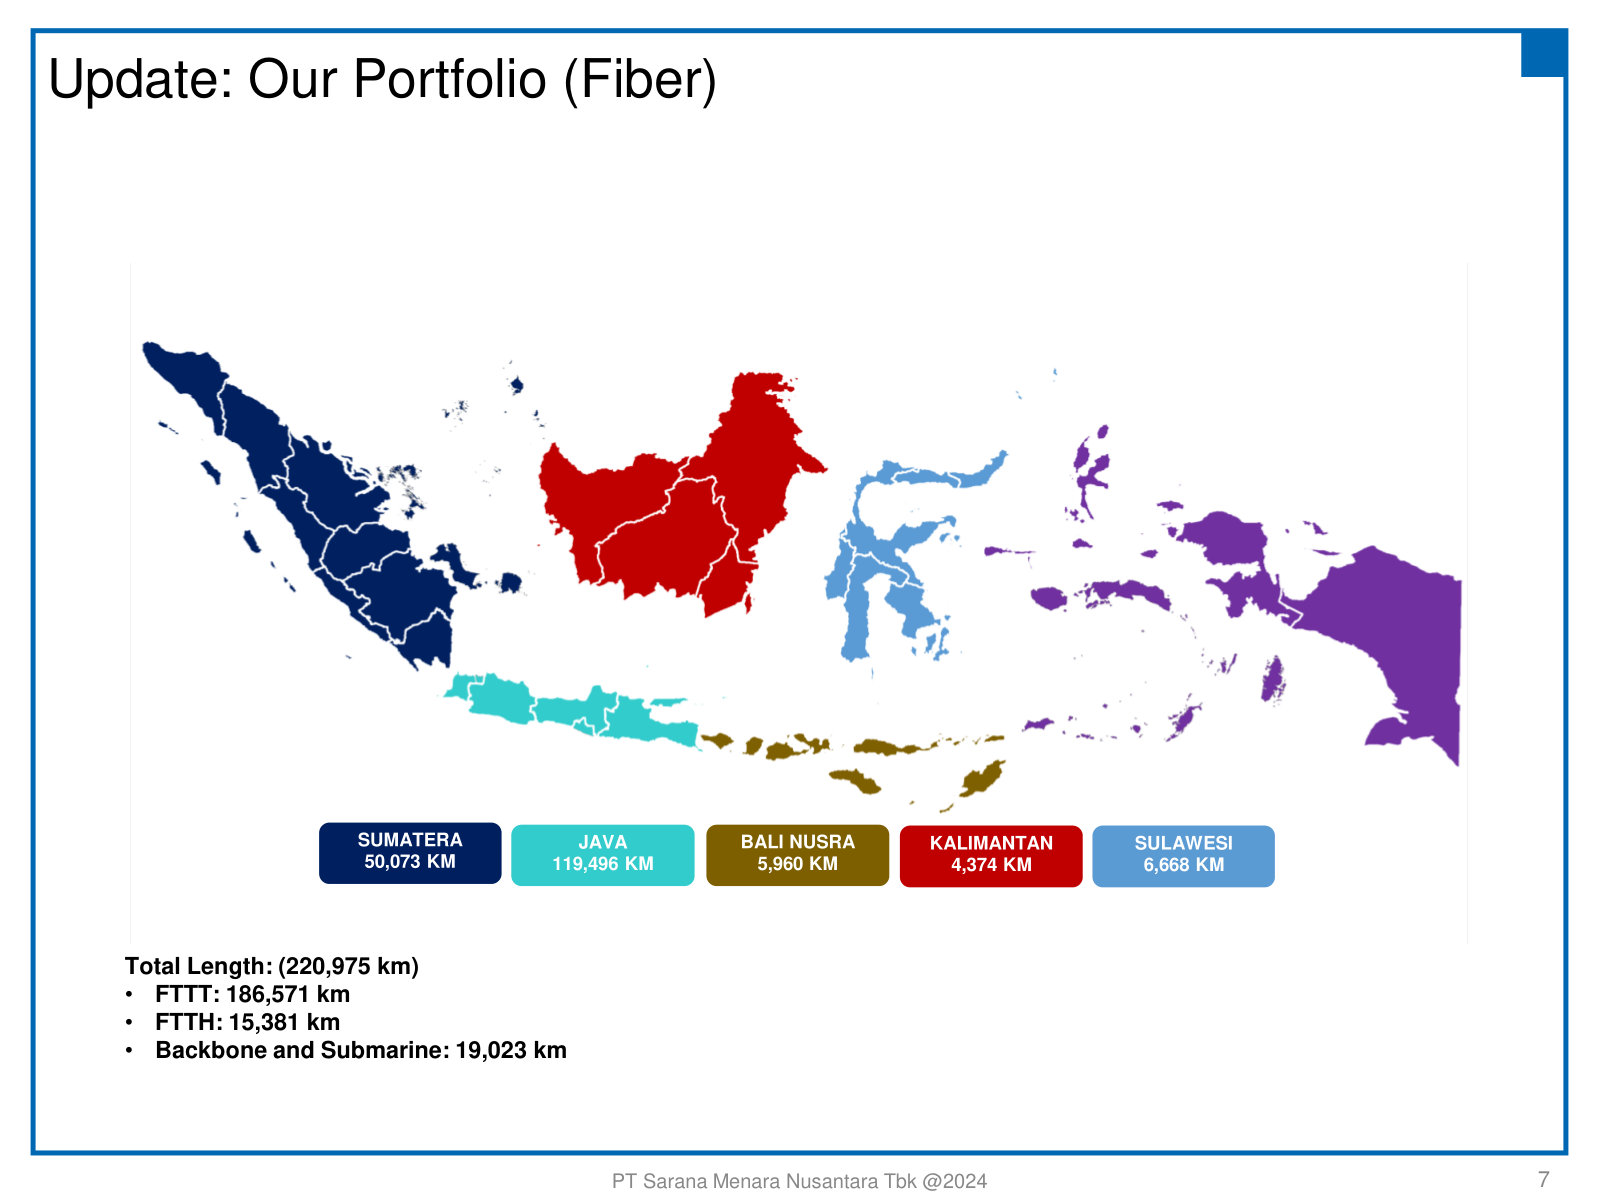
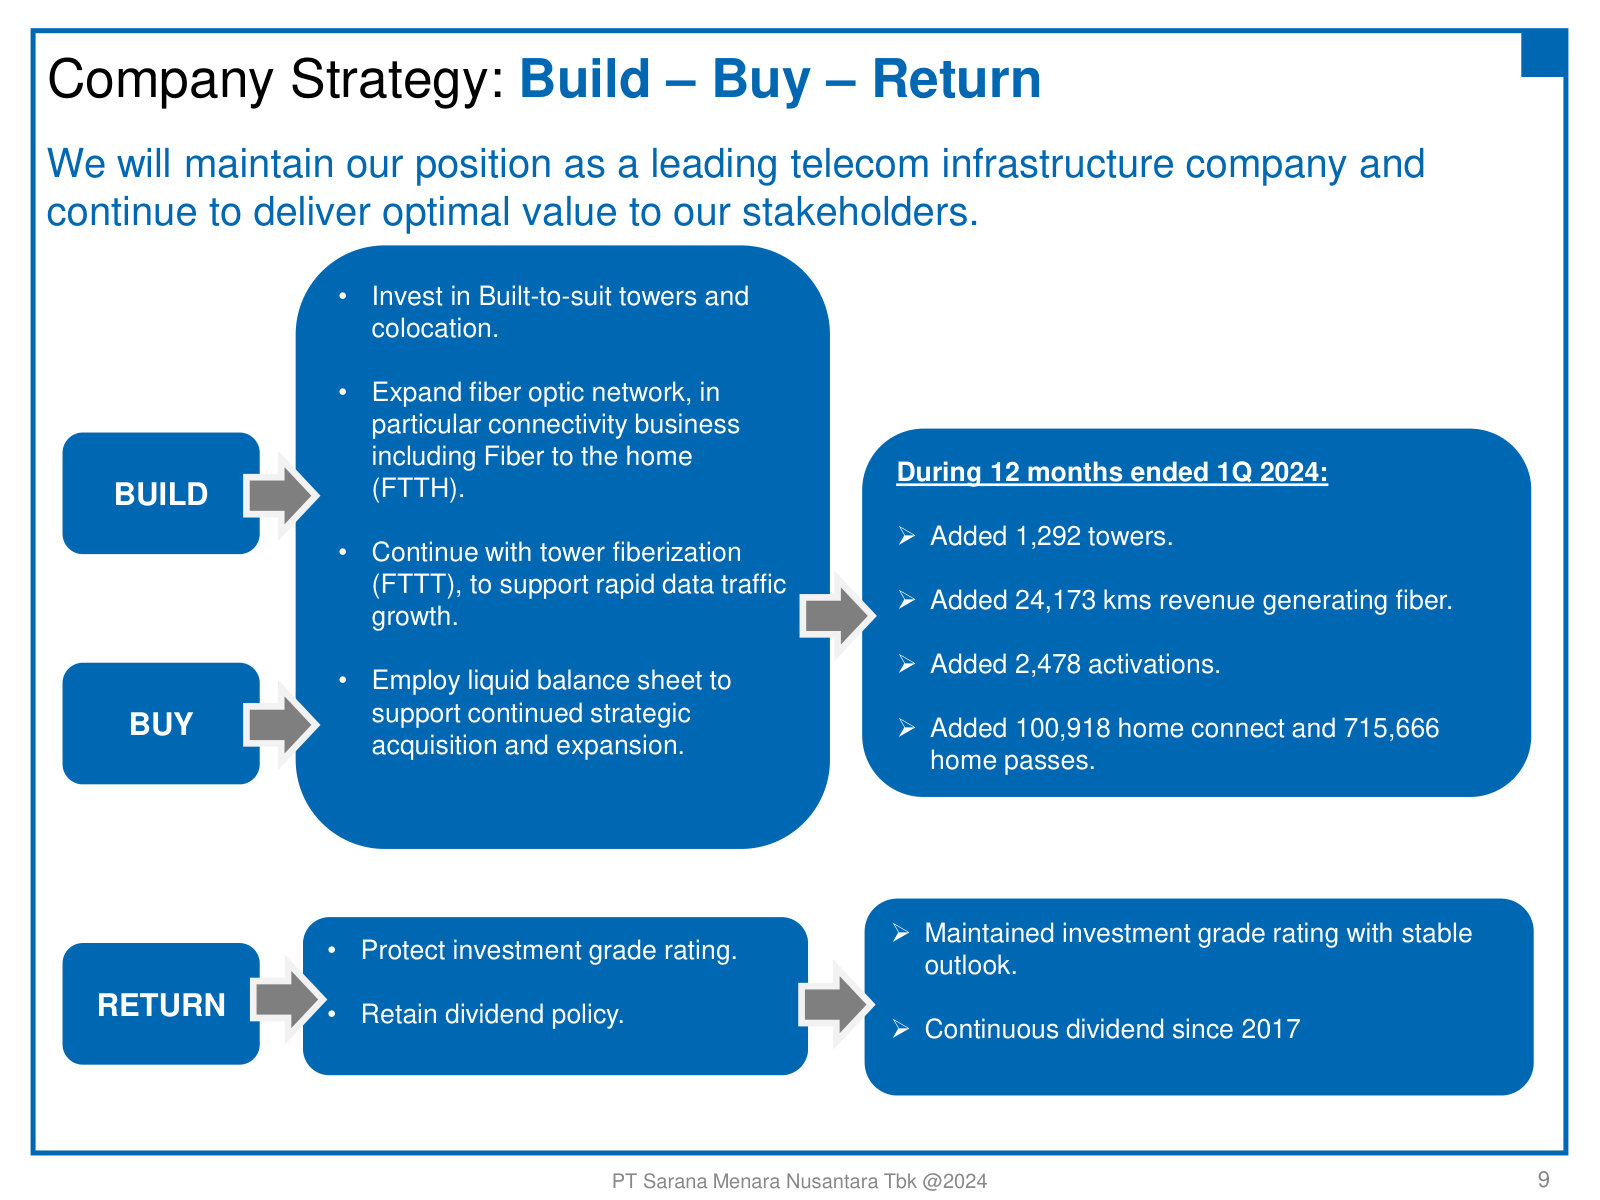
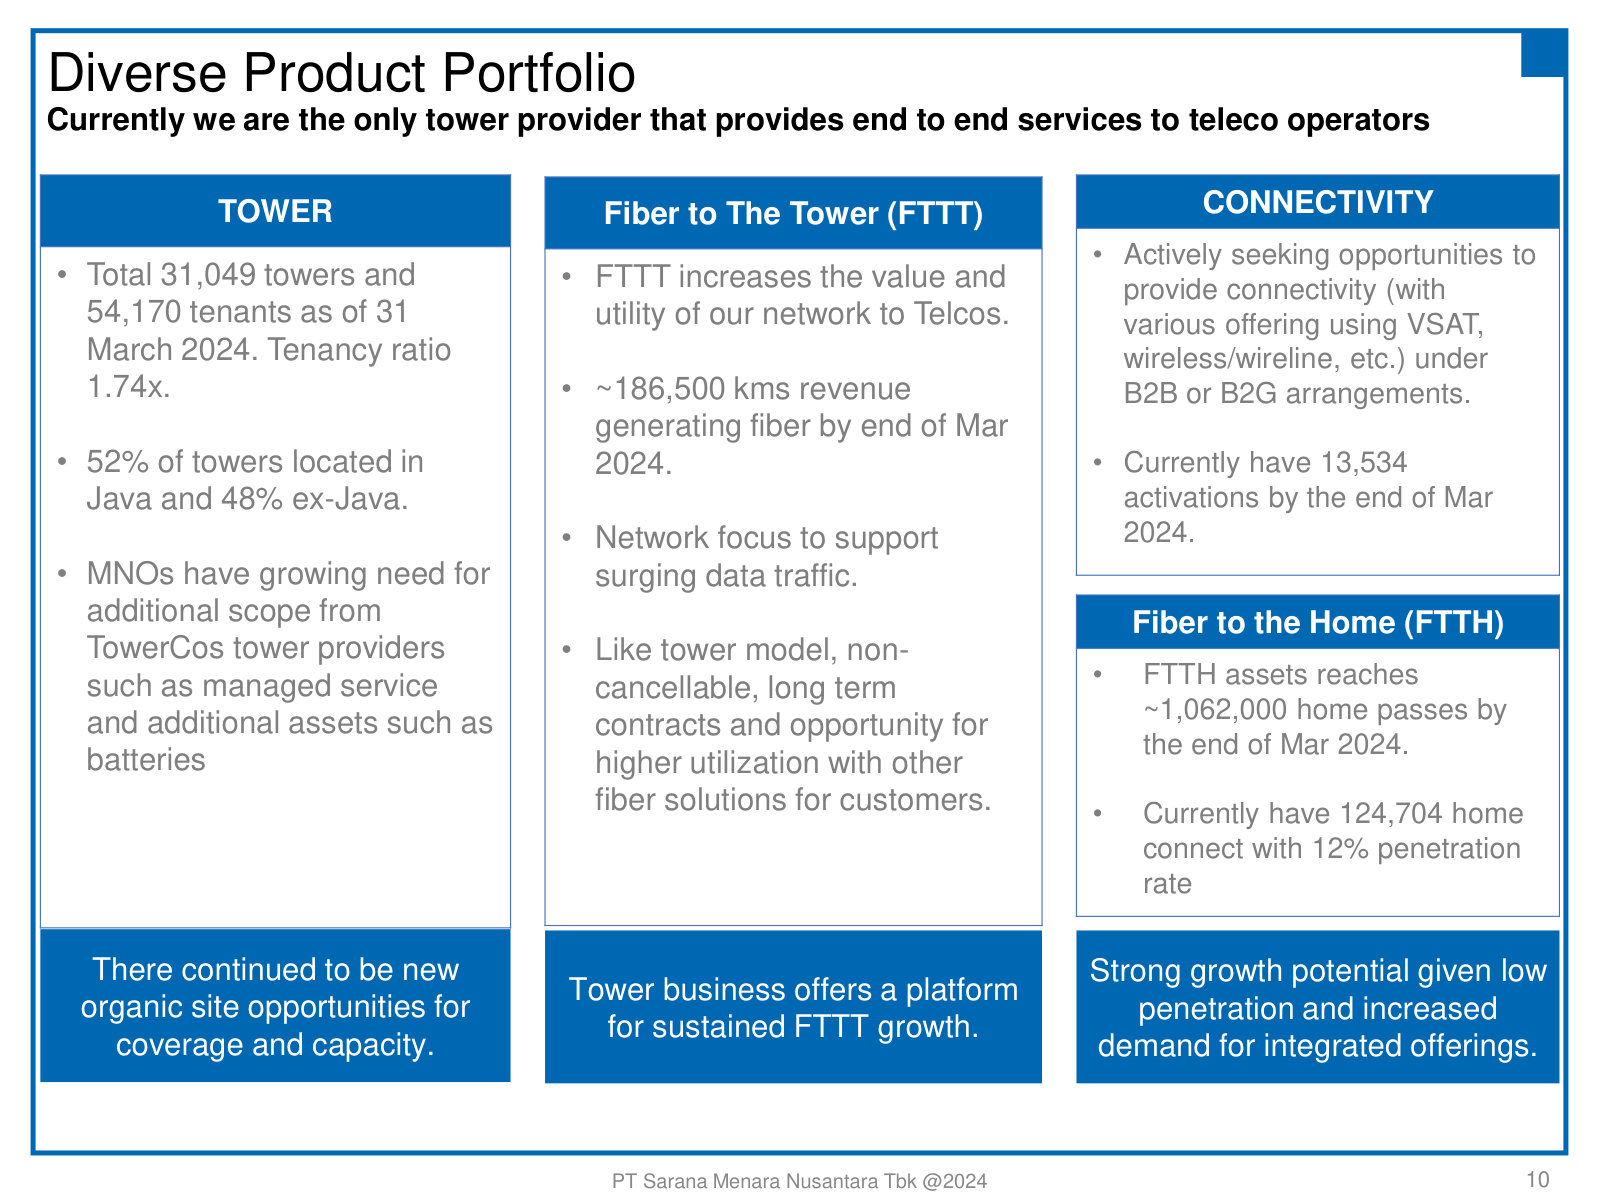
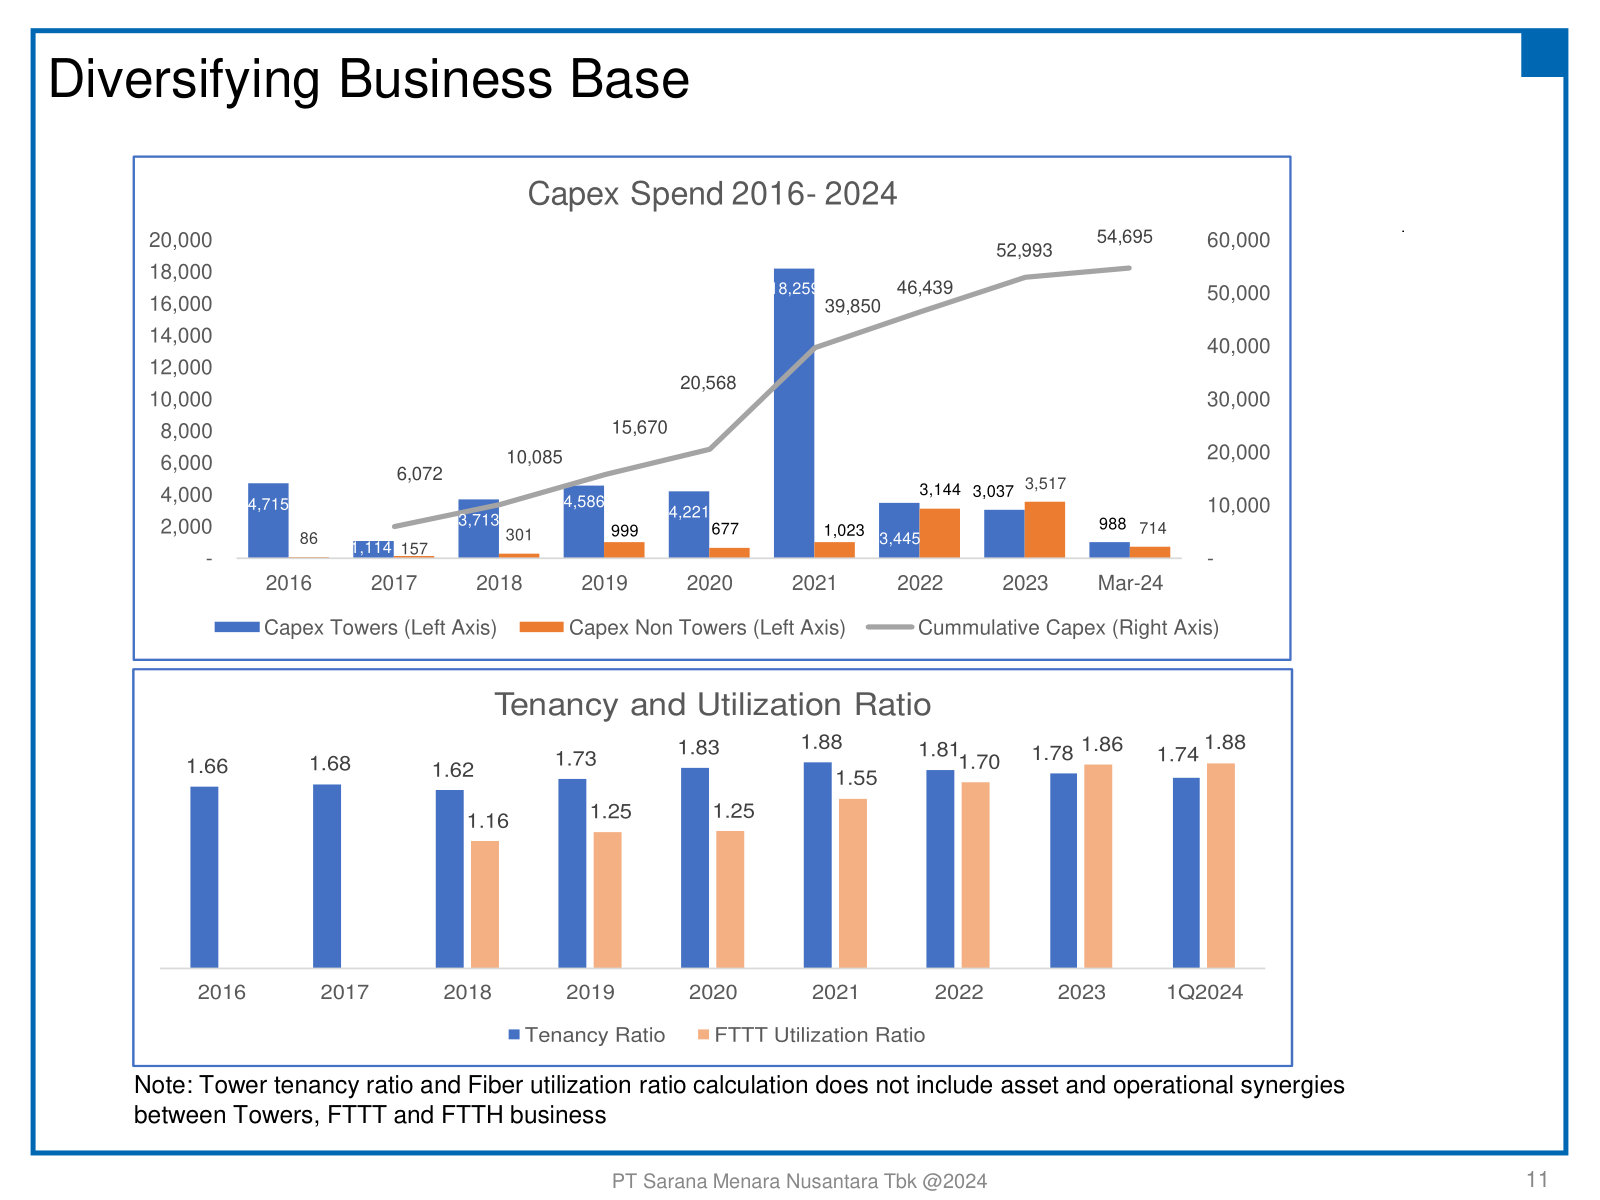
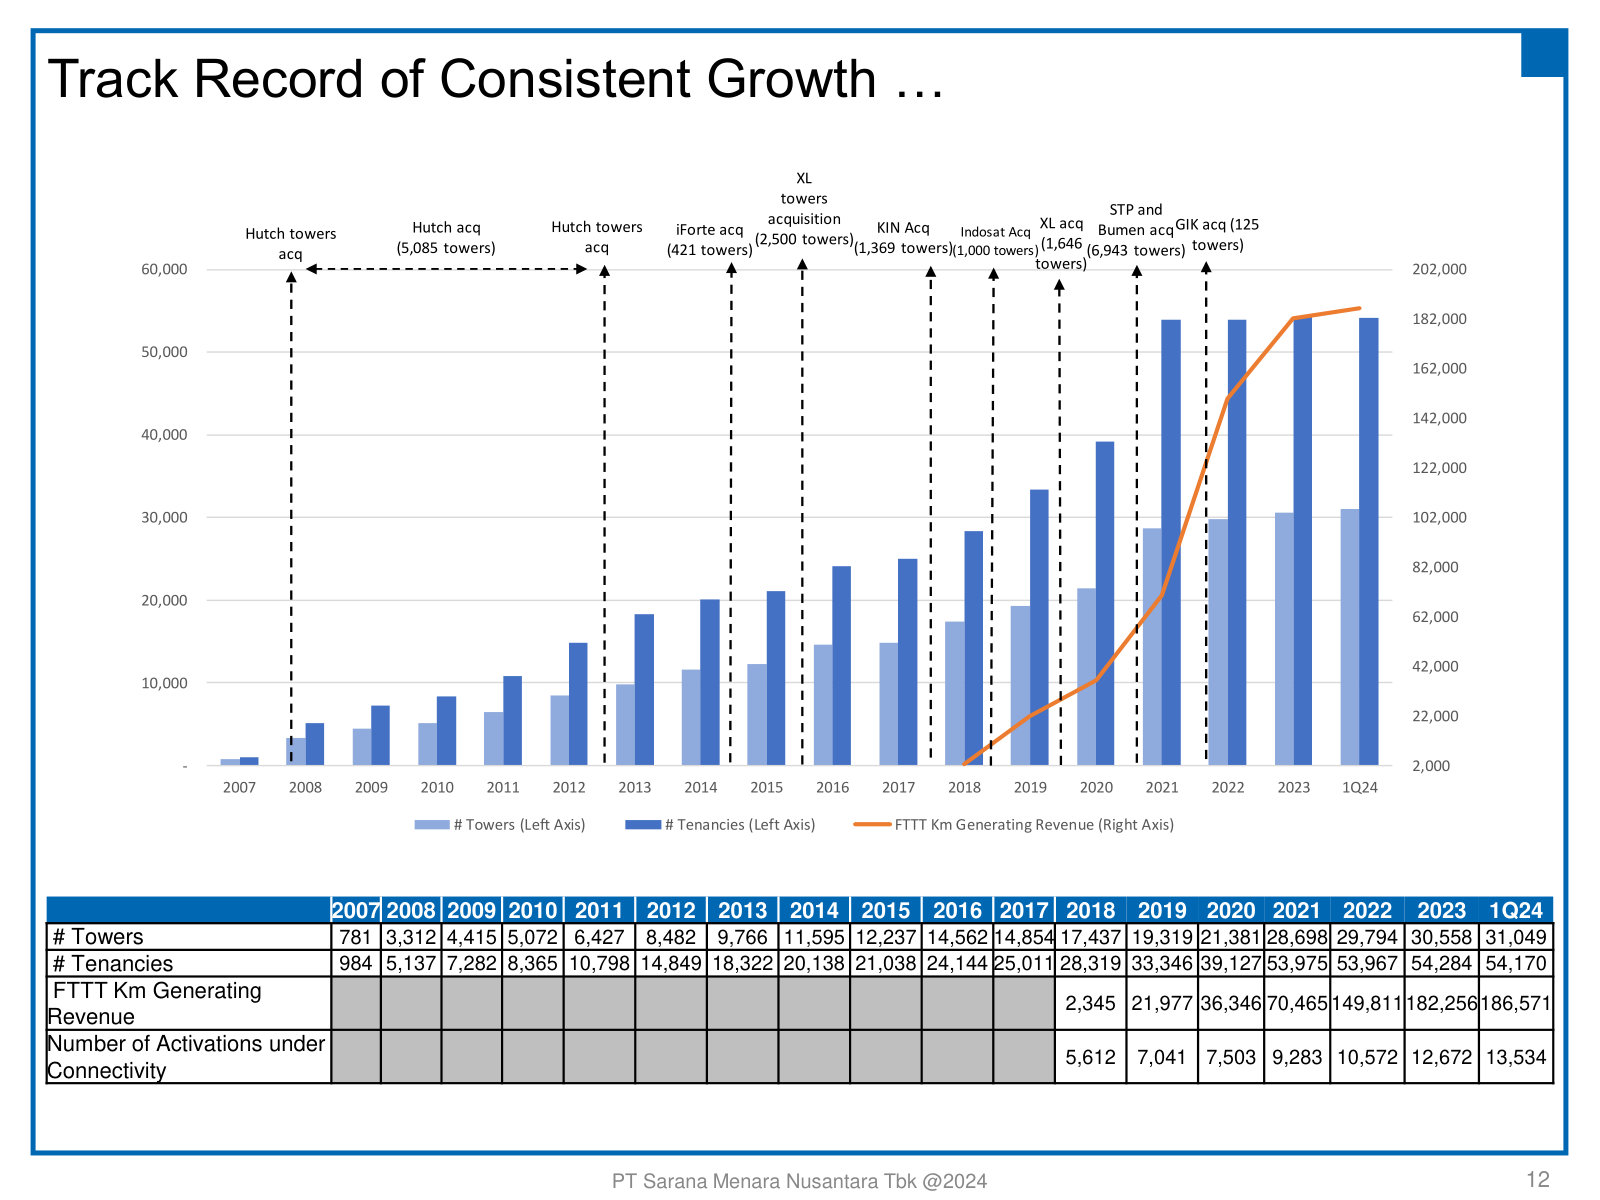
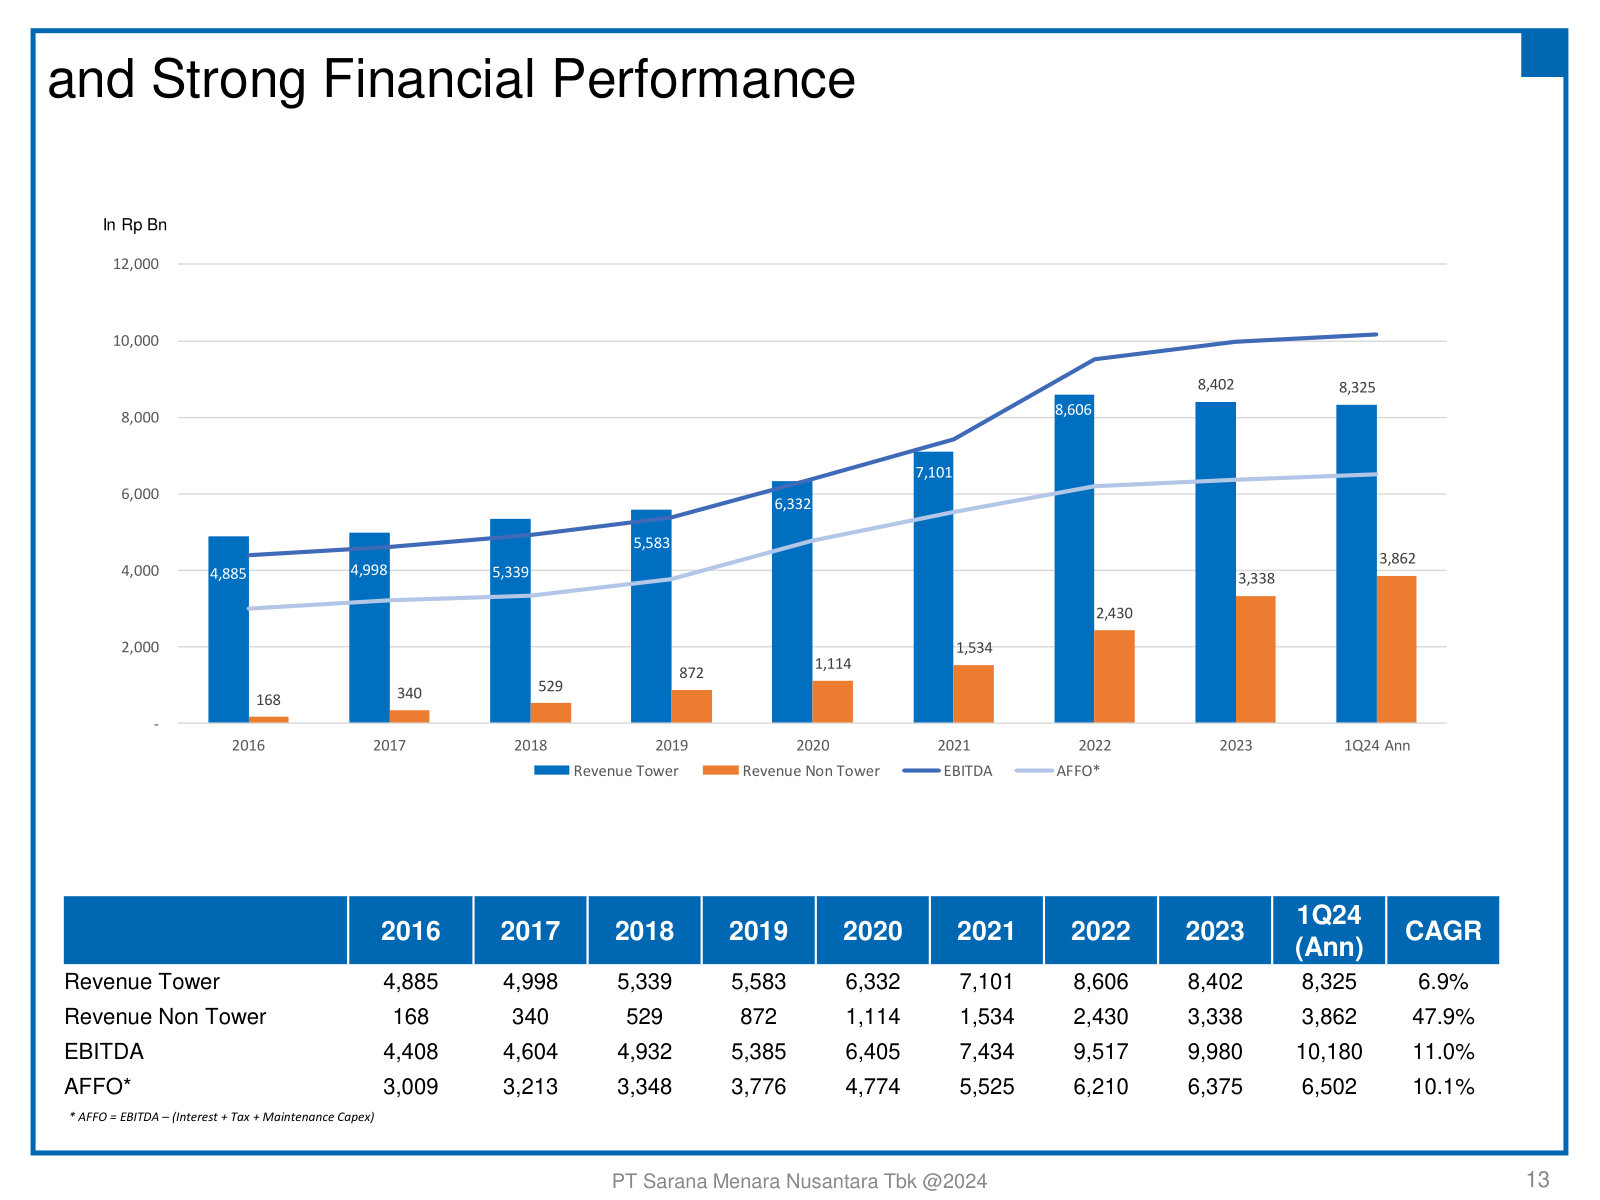
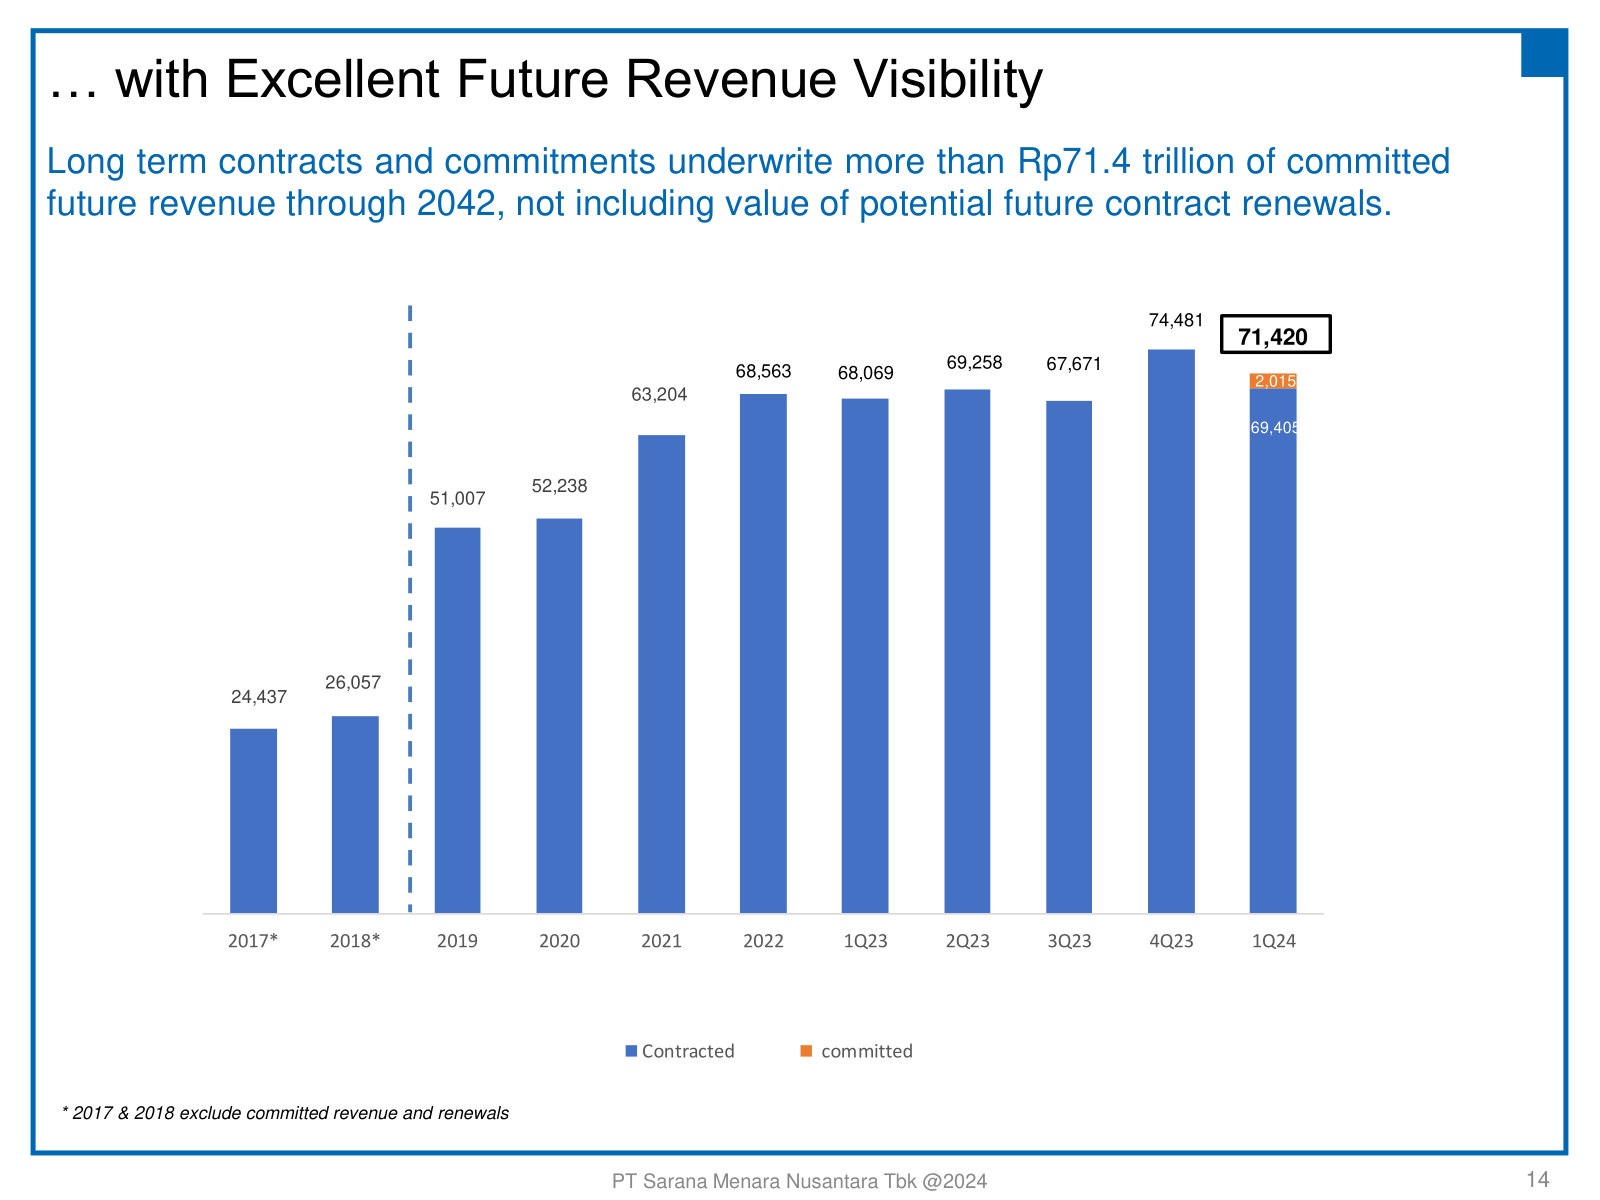
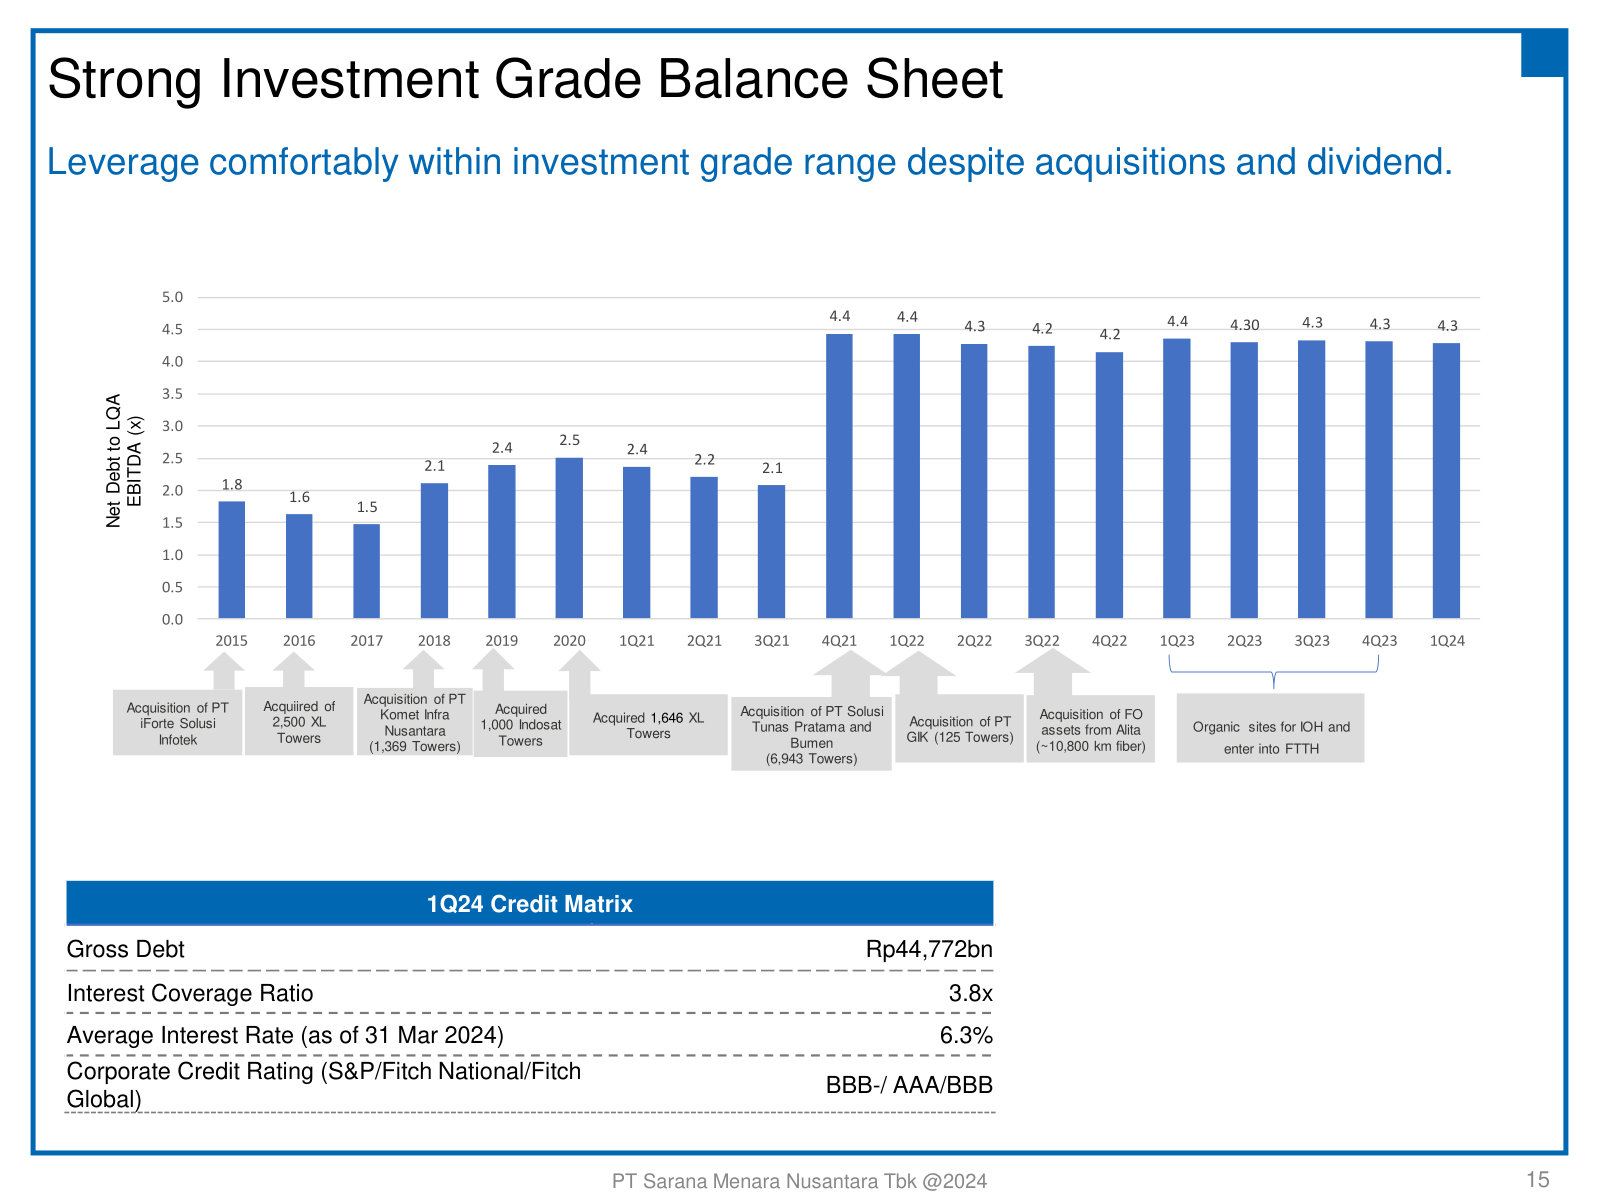
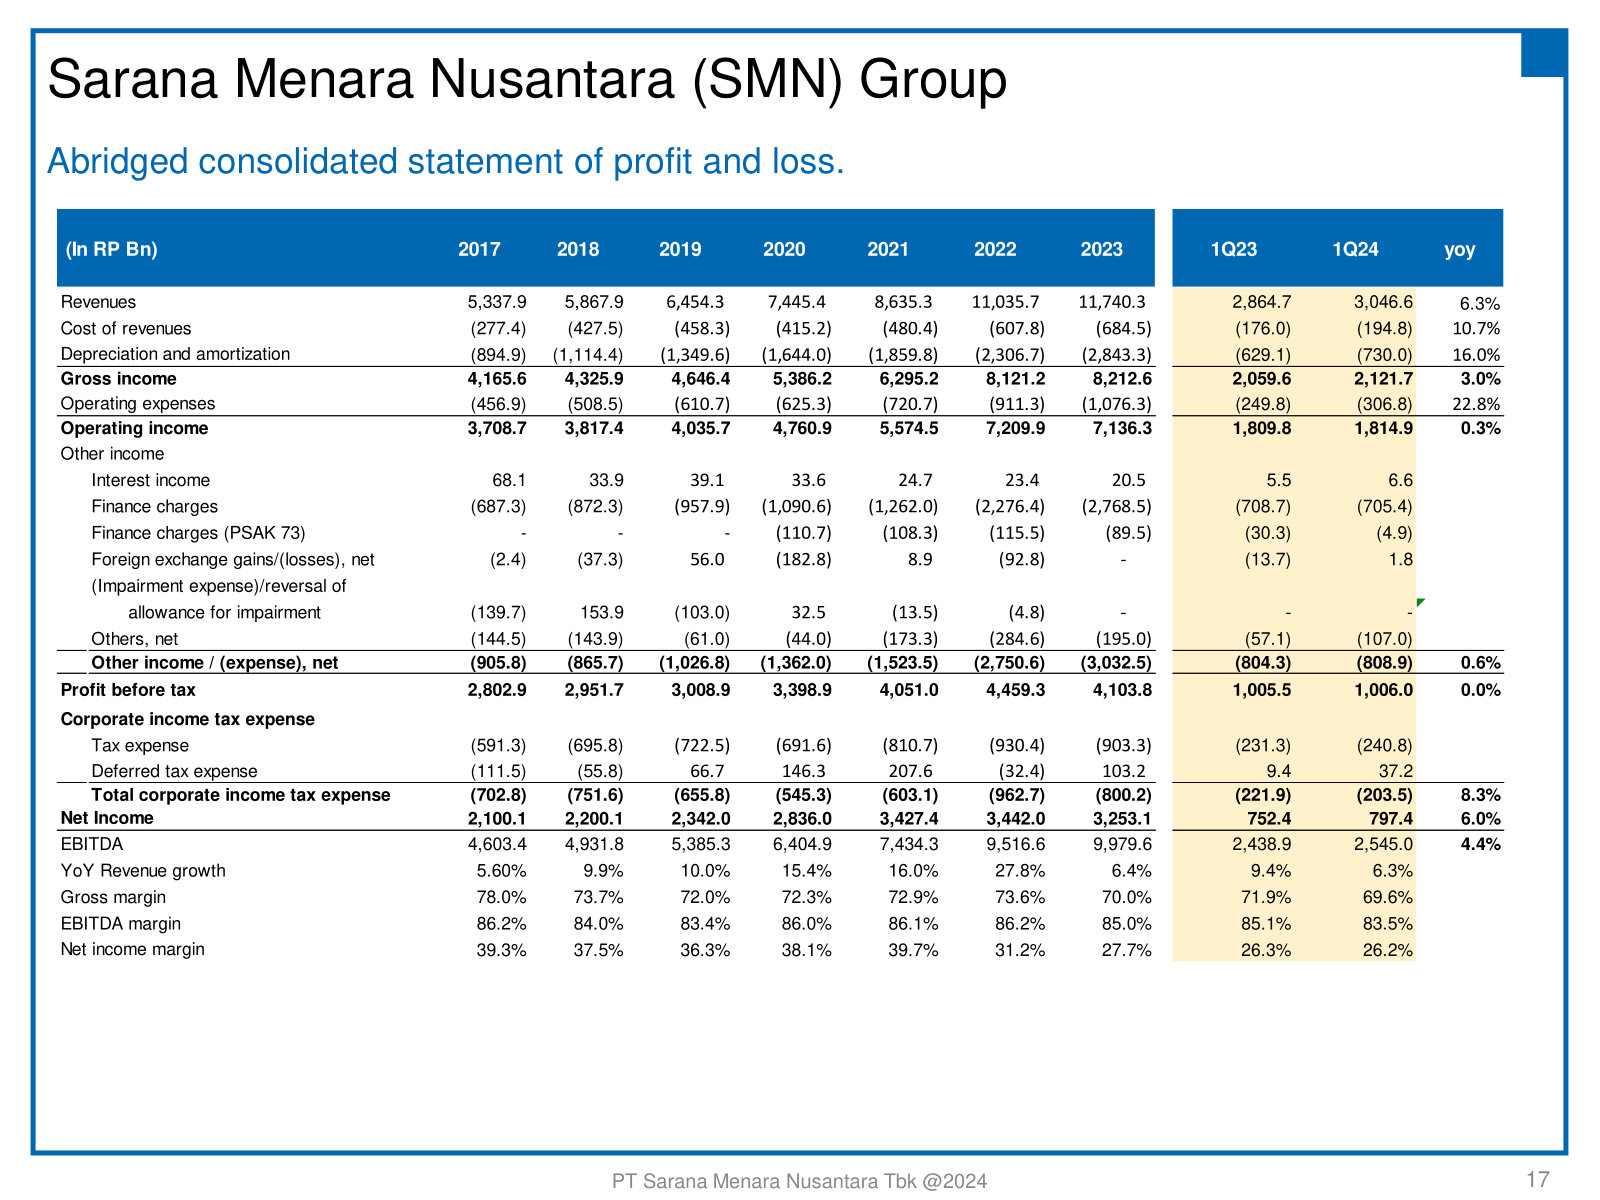
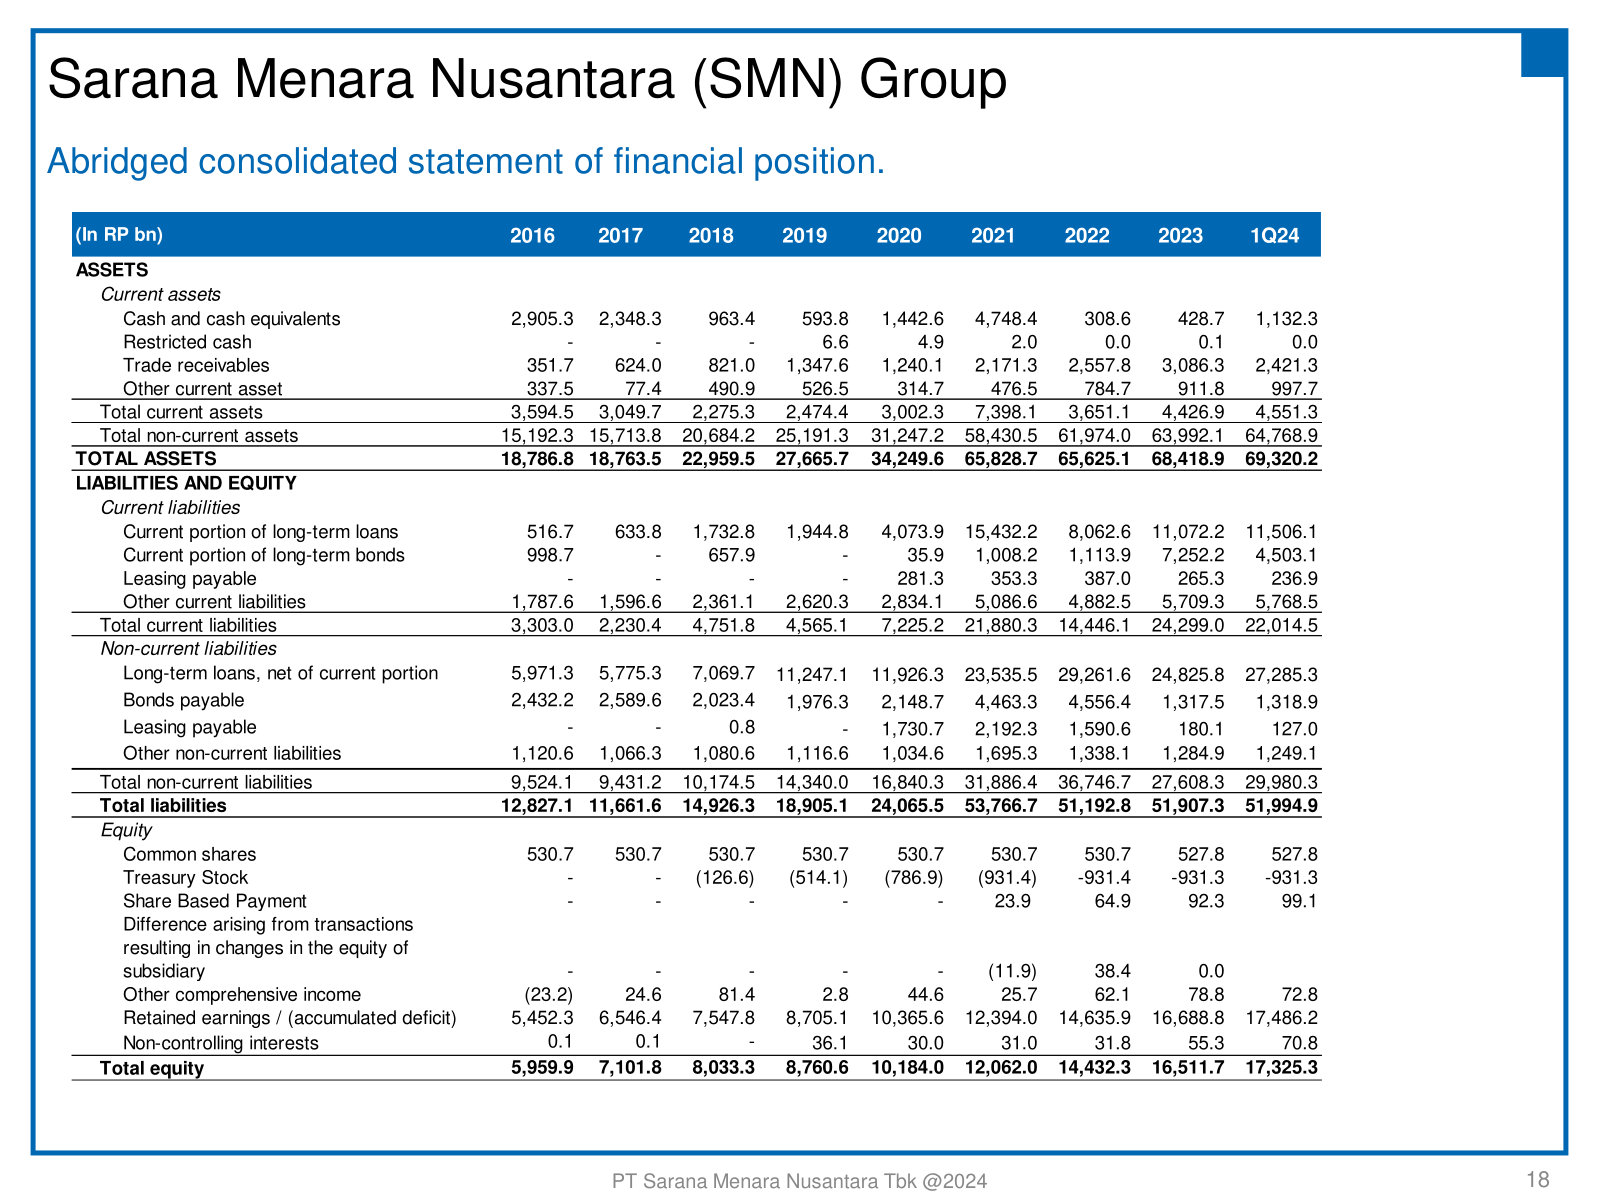
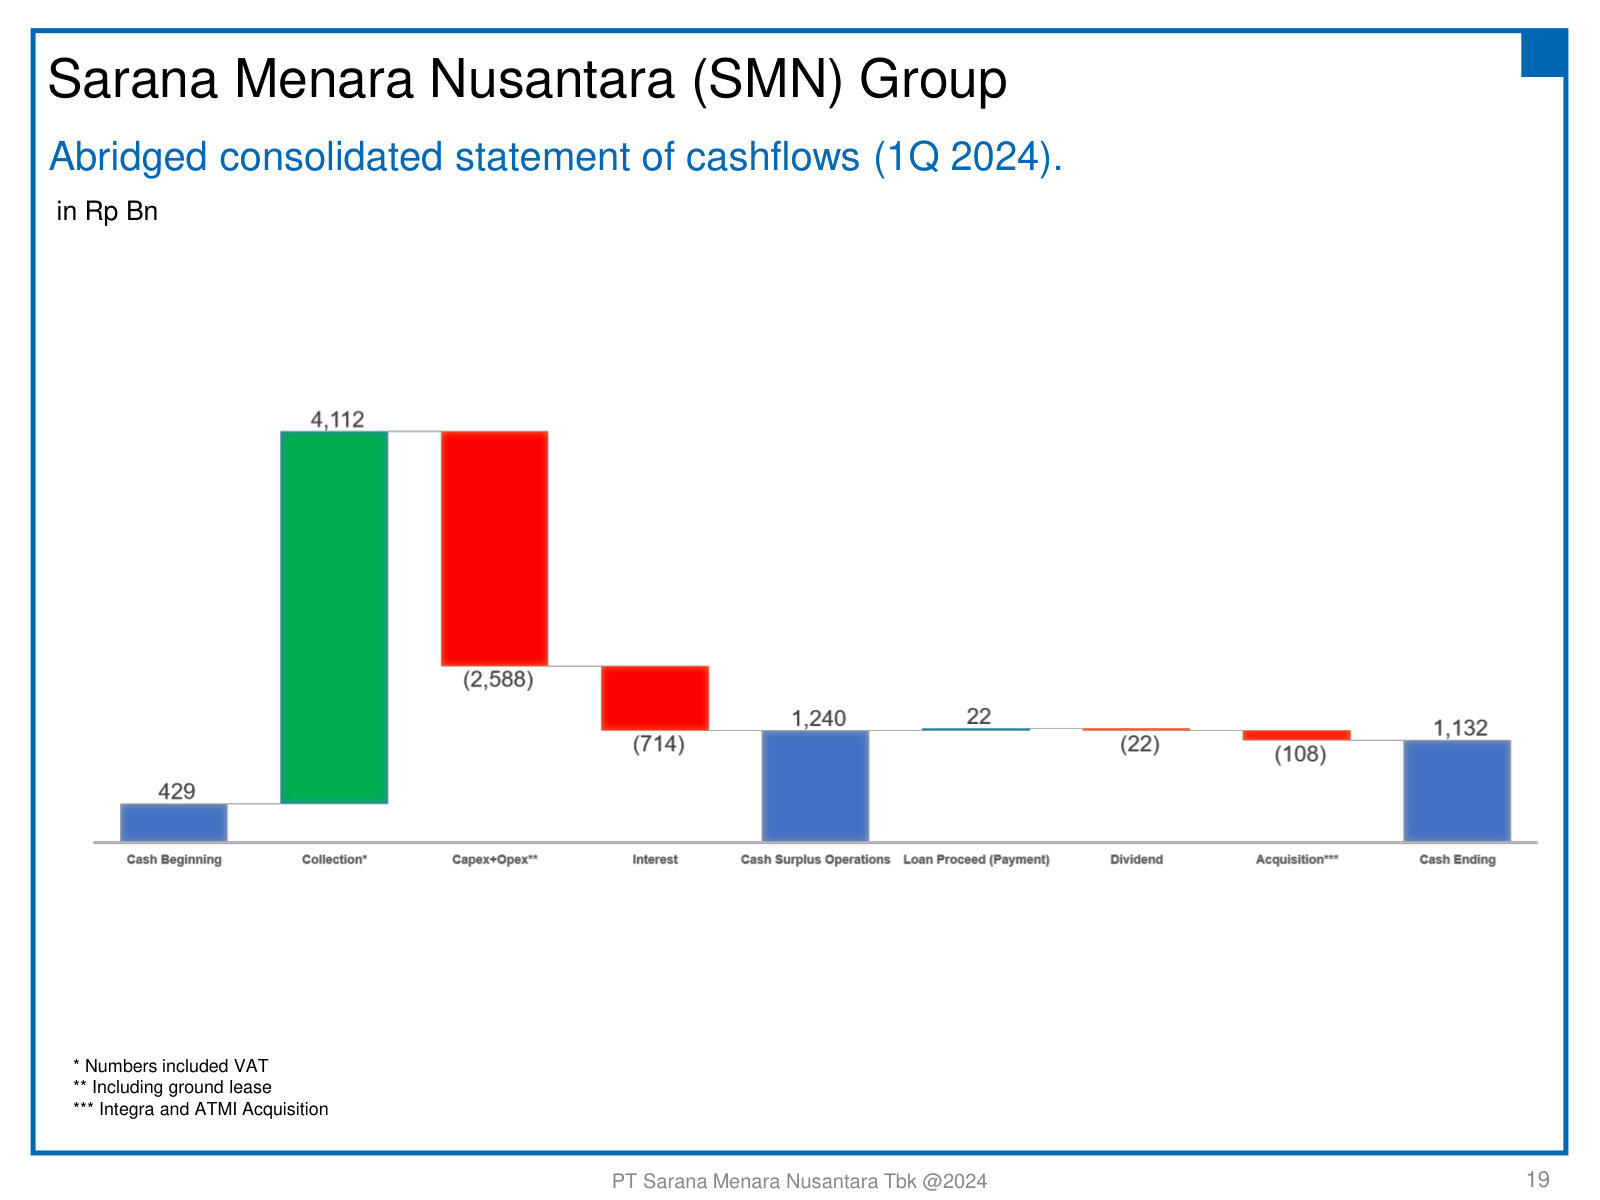
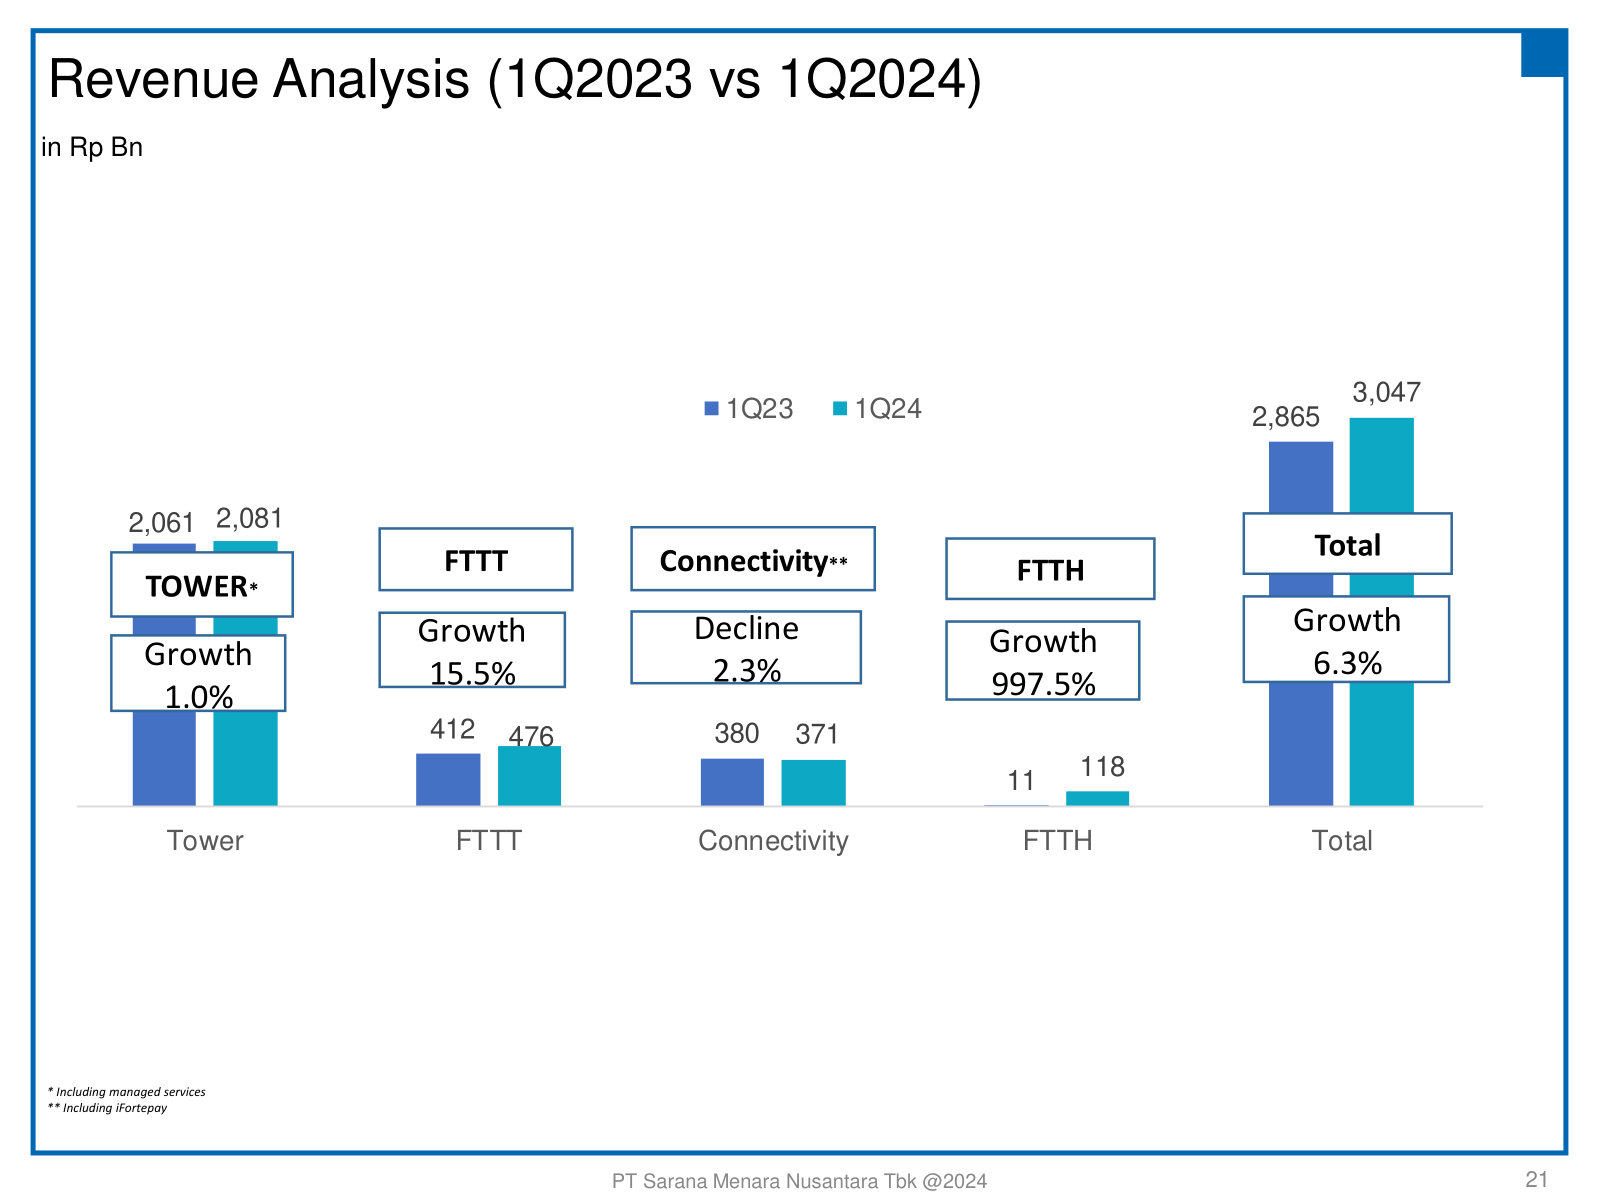
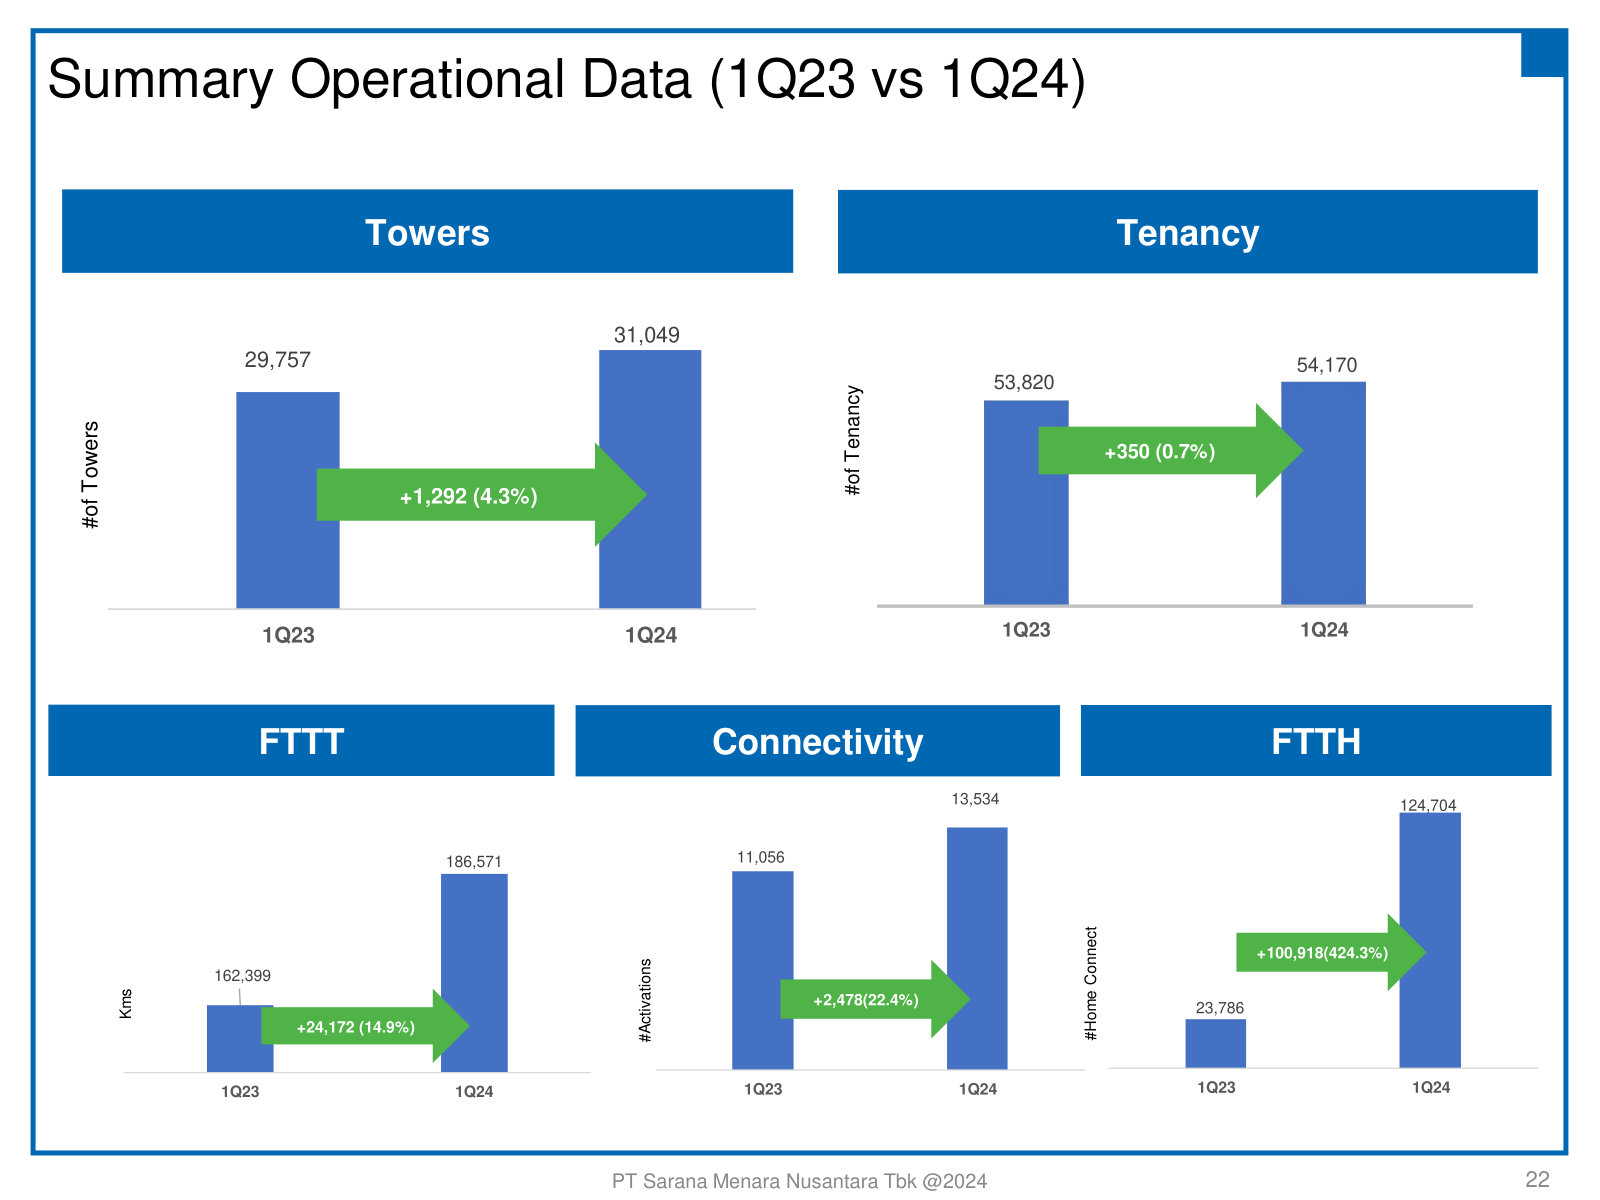
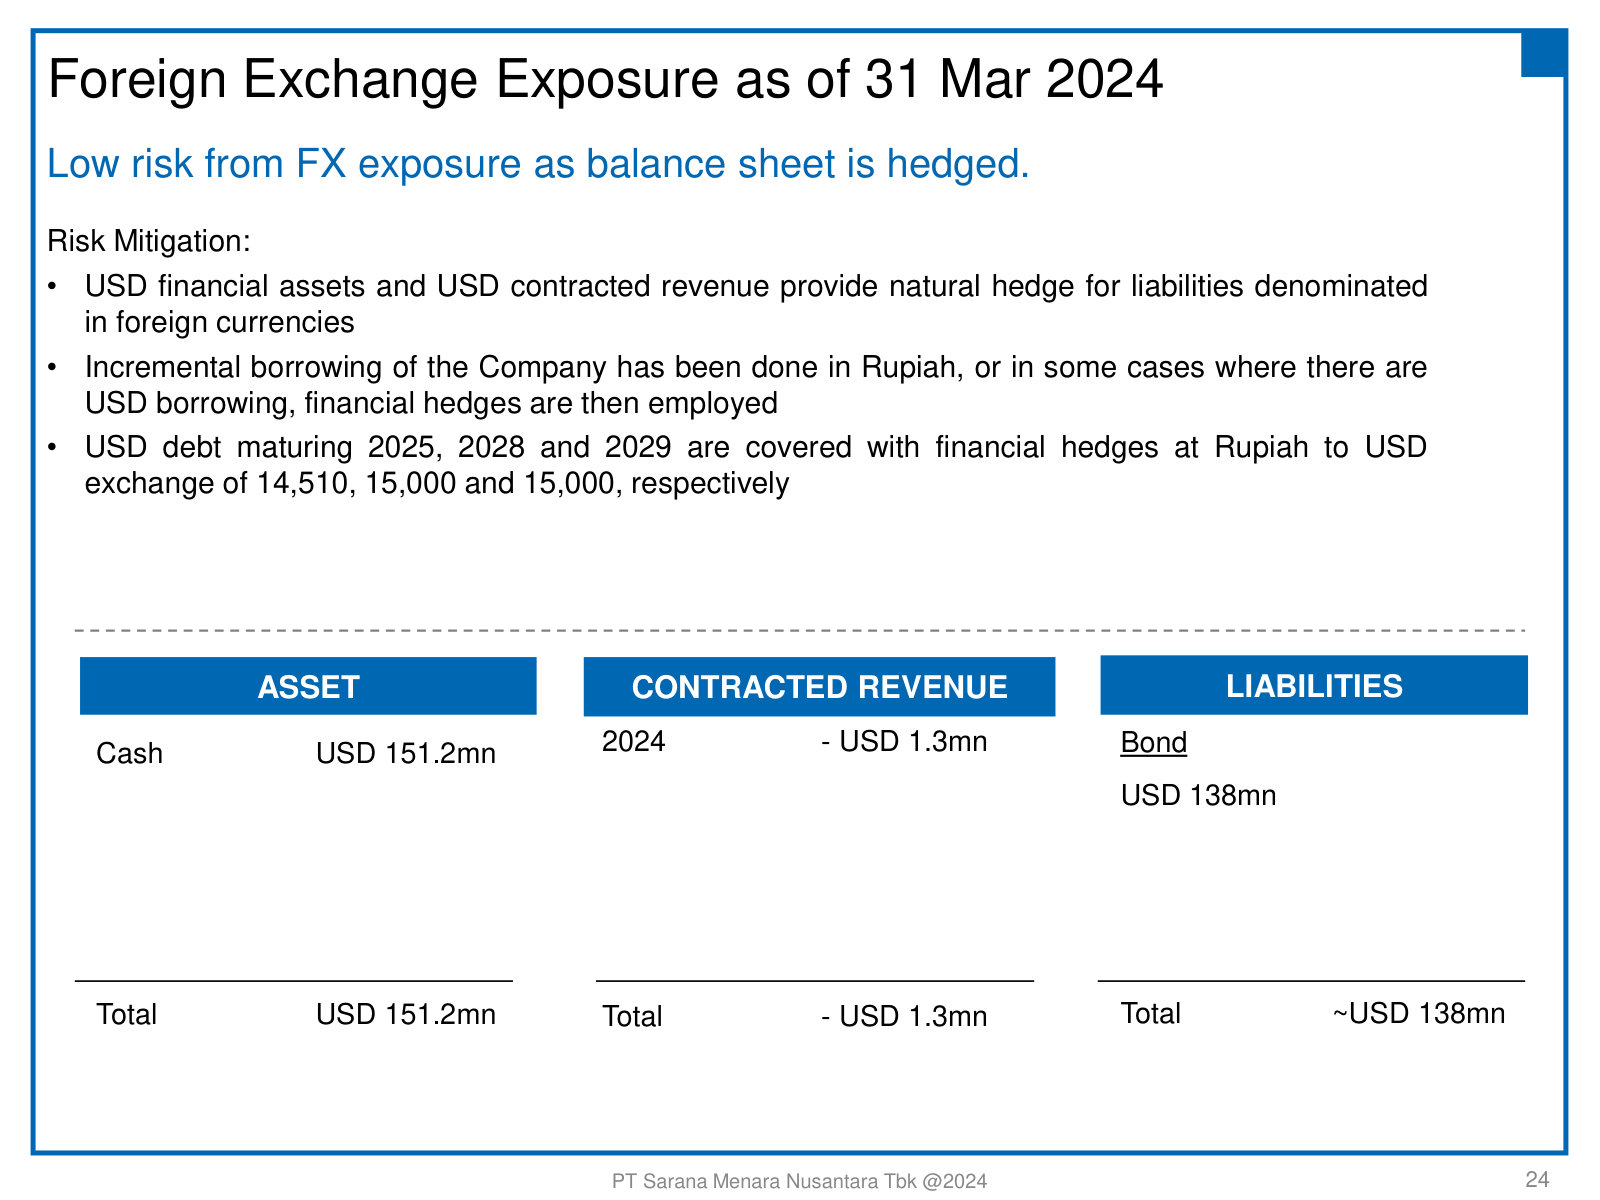
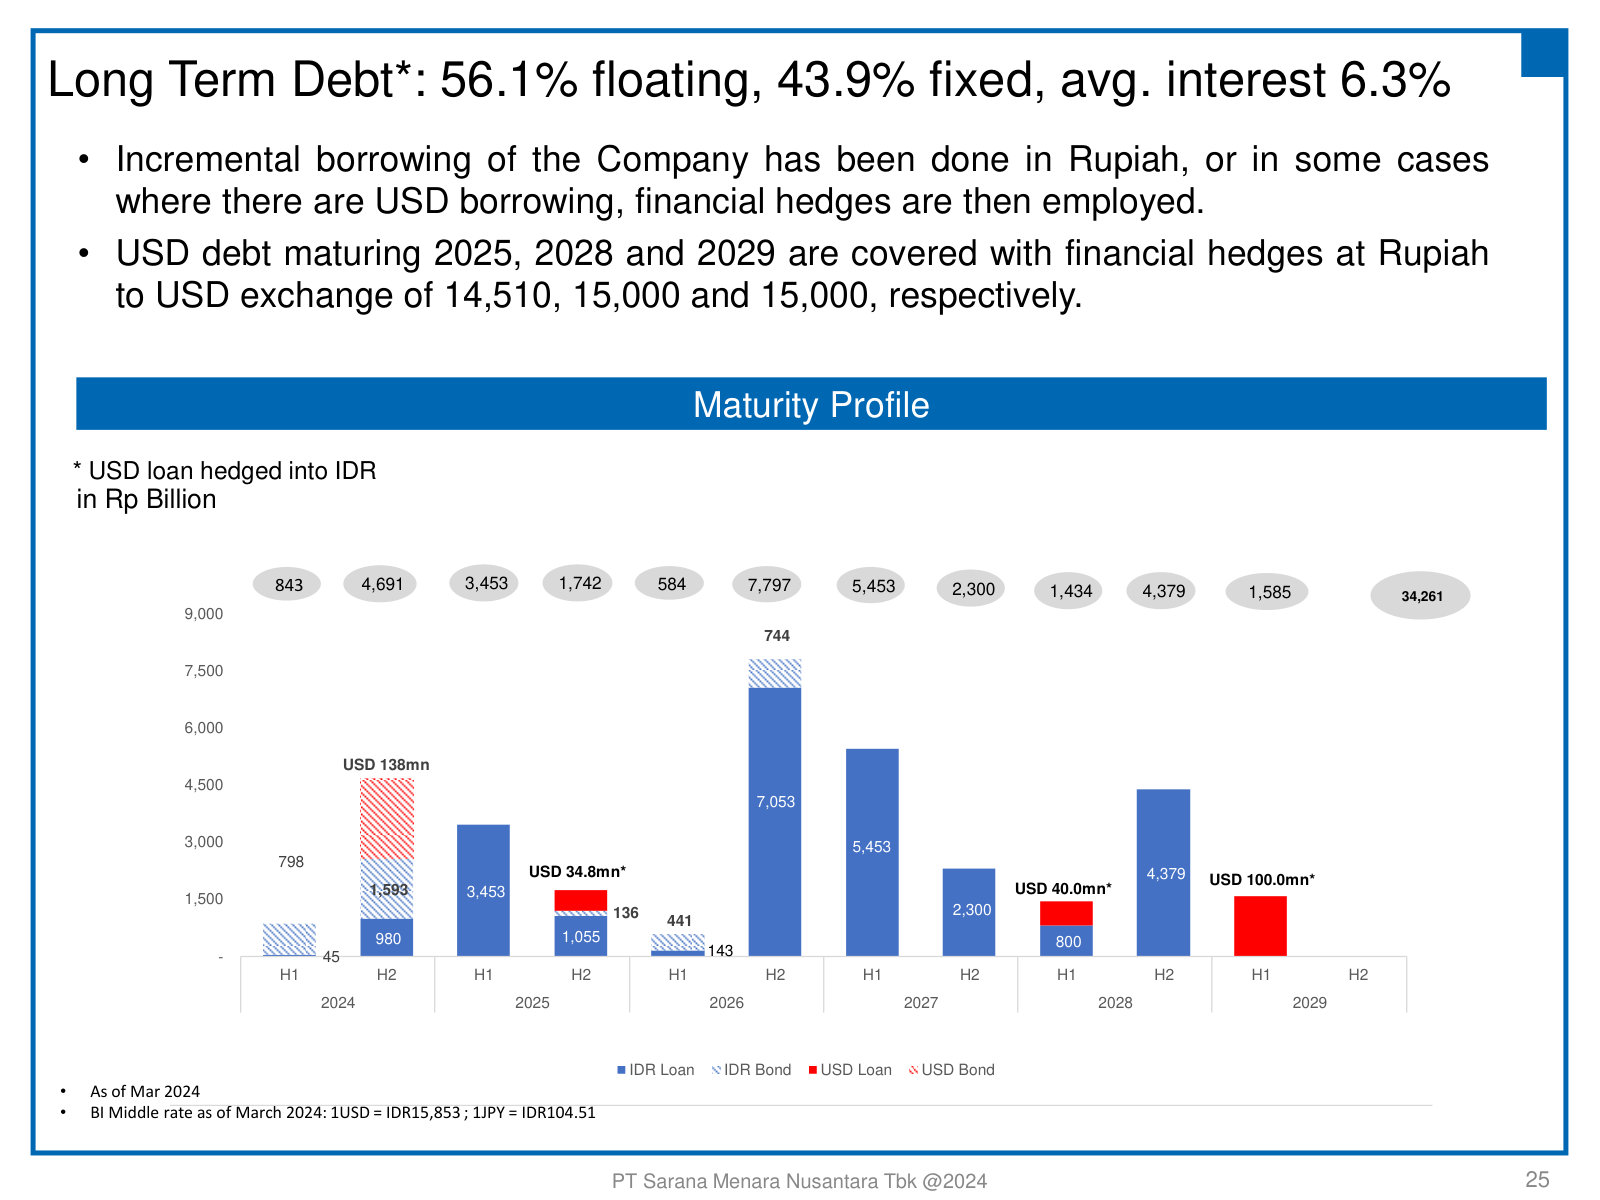
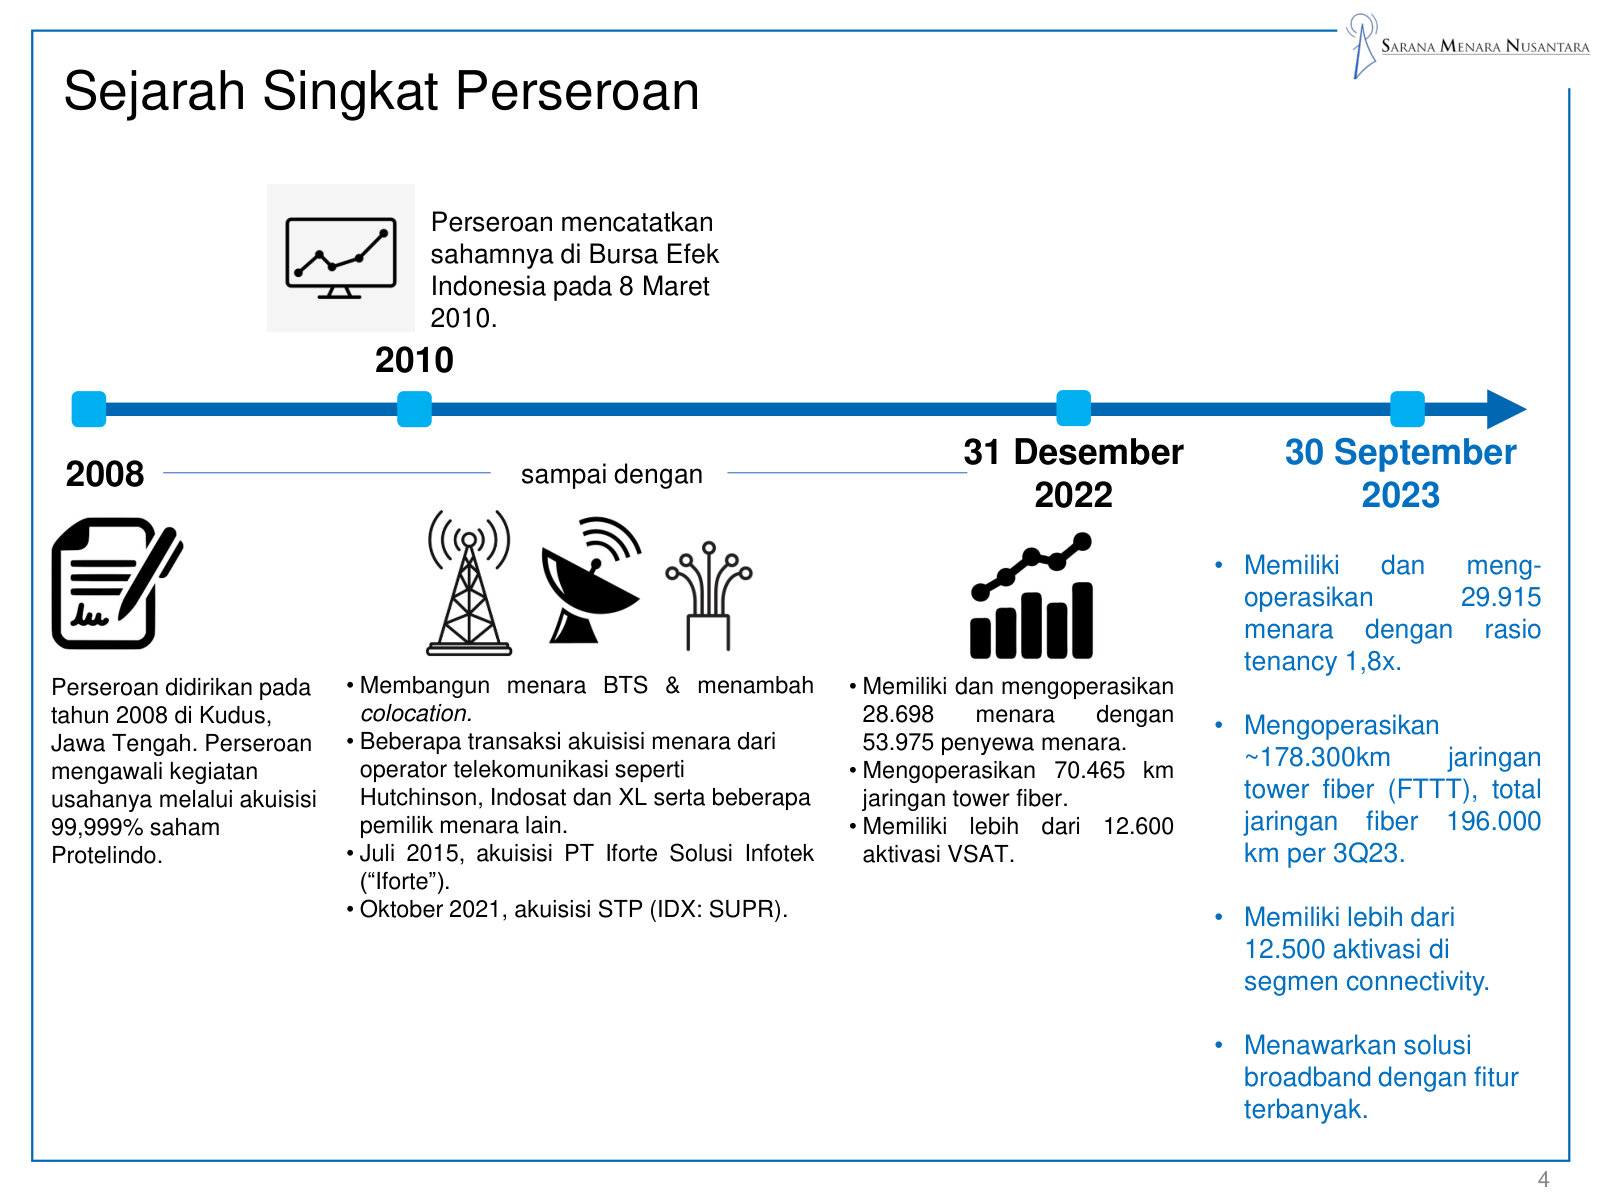
PT Sarana Menara Nusantara Tbk.'s management explains the business in its own materials. The slides below do the most of that work, pulled from the documents preserved in Sources. Each source link opens the complete presentation at that slide in a new tab.
Public Expose 2024 — Aug 2024
The company's fullest self-explanation in English — from business model and tower unit economics through segments, financials and debt. · Open the full document →
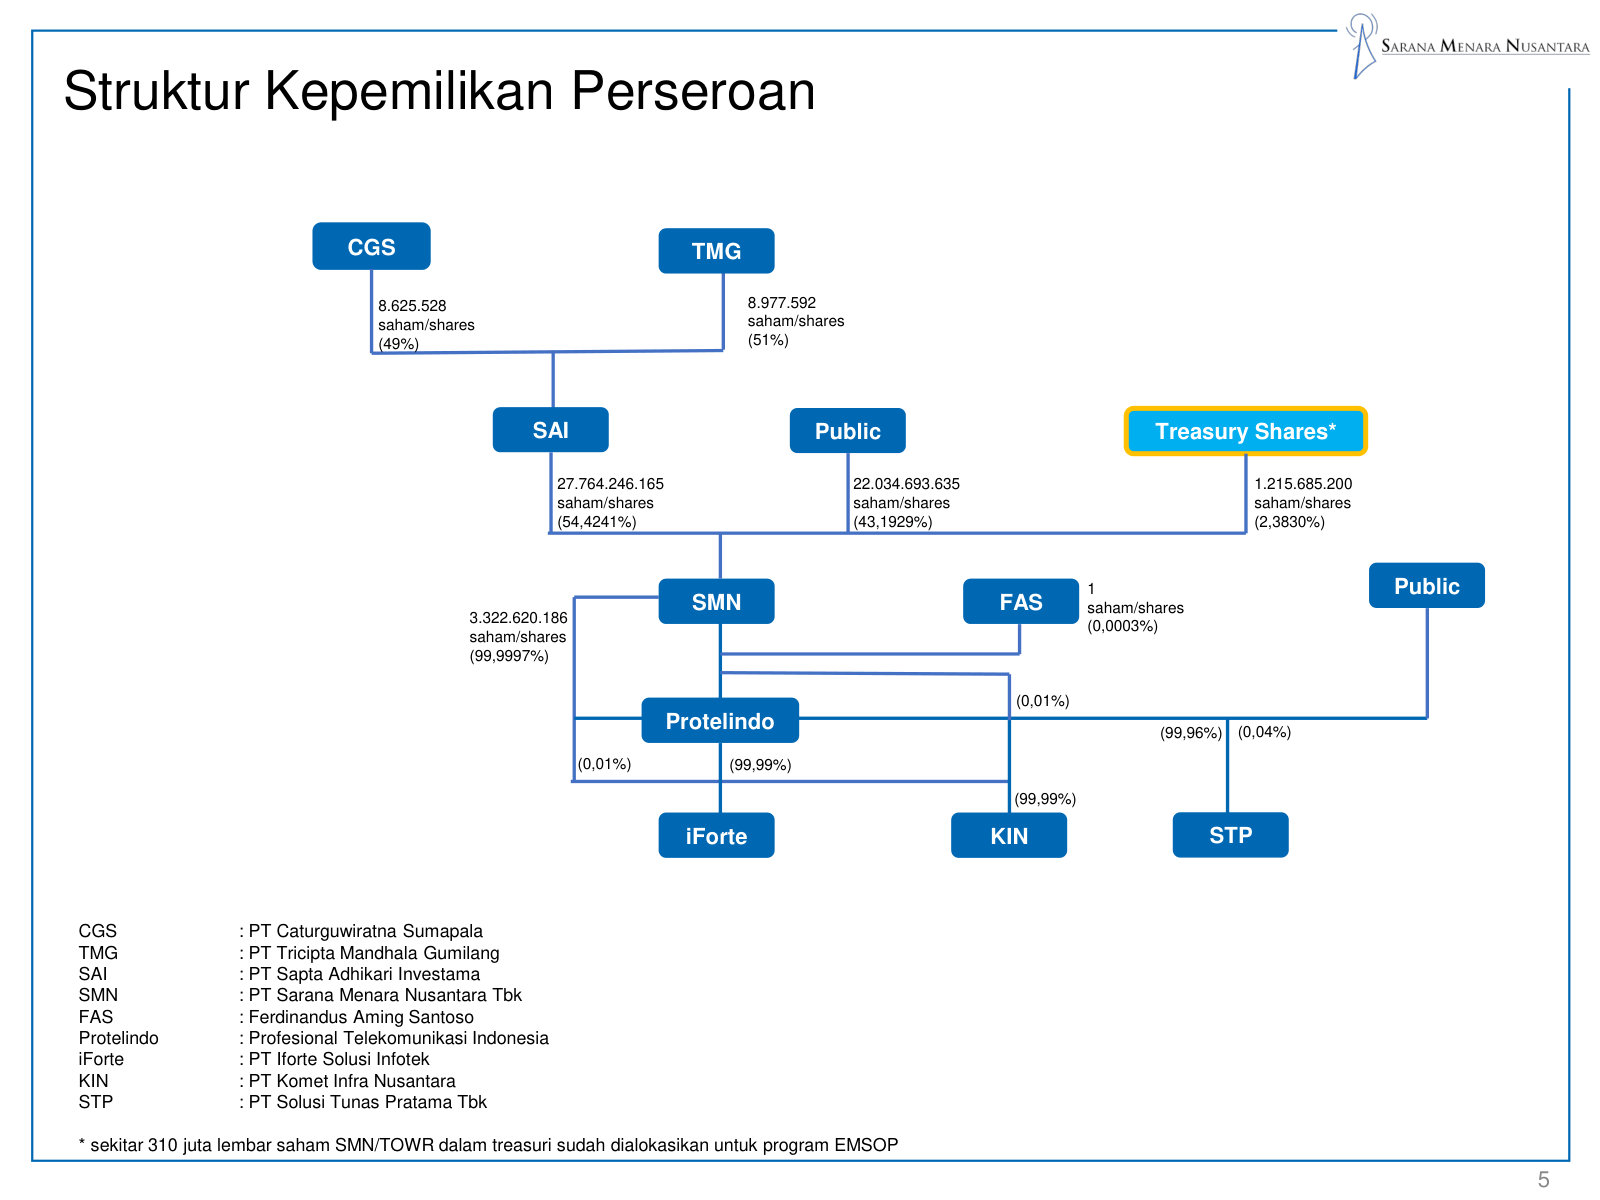
Public Expose 2023 (Indonesian) — Nov 2023
The prior-year deck, kept only for the two things the 2024 edition drops: company history and the full ownership structure. · Open the full document →
PT Sarana Menara Nusantara Tbk.'s management answers for the business every quarter. These are the exchanges that explain it best — verbatim, from the call transcripts preserved in Sources. Each link opens the full transcript at that page in a new tab.
Q4 FY2025 Earnings Call (Full-Year 2025 Audited Results) — Q4 FY2025
The only available transcript, and a good one: management walks through the tower-and-fiber model, why consolidating carriers depend on it, its pricing discipline and financing, and a deliberately cautious 2026 outlook. · Open the full transcript →
The full-year 2025 audited headline: revenue up IDR 4.6tn to IDR 13.3tn, EBITDA +2.5%, net profit +10.3%.
Adam Gifari (Adviser & Group Investor Relations, PT Sarana Menara Nusantara): So as you can see here, we reached full year operating revenue of IDR 13.3 trillion, representing a IDR 4.6 trillion increase for 2025 compared to full year 2024. […] EBITDA reached IDR 10.97 trillion, growing by 2.5%, while net profit after minority interest stood at IDR 3.678 trillion, an increase of 10.3% year-on-year.
p. 1 · Read in context →
The scale and why carriers can't route around it: 50%+ of the merged XL-Smartfren network sits on its towers, plus pricing discipline.
Adam Gifari (Adviser & Group IR): given we have 170,000 kilometers of fiber, we have 35,000 towers. We see that we have one of the largest independent digital telecommunication infrastructur provider. […] So the merger of XL Axiata and Smartfren, which opens up significant opportunities. They need us because more than 50% of the network is on our towers, and they use a lot of our fibers as well. […] We think we – in the infrastructure space, we are among the leaders of pricing discipline. That yield remain relatively low, but what we provide to the industry is actually something very efficient compared to where people would go out of pocket, spend their own capital to build towers and fiber.
p. 2 · Read in context →
How it funds itself — targeting the country's cheapest capital, ~$1.3bn of liquidity — and a market now down to three carriers.
Adam Gifari (Adviser & Group IR): Access to low cost of funding is discussed all the time. We want to be sure that we have the best cost of capital in the country. […] So liquidity amount was $1.3 billion equivalent in rupiah mostly, given banks are also having trouble to find other businesses that is as stable as ours. […] the telecom space has come down to 3 players basically during 2025, as we all know, with the most recent merger, XL and Smartfren.
p. 4 · Read in context →
No hedge accounting: a weaker rupiah only hits the P&L as mark-to-market when the USD debt is actually repaid.
Adam Gifari (Adviser & Group IR): While we are on this slide, I received a question whether we would get a ForEx gain or ForEx loss if rupiah continues to depreciate. […] I think our response to that is that we do not have hedge accounting, which means there is not direct correlations between certain depreciation in rupiah with our P&L or appreciatio in rupiah into our P&L. So only by the time we basically pay down the debt and we enjoy a positive mark-to-market by the time we pay, then we see a positive result in that moment, in that quarter, for instance, when we pay down the debt.
p. 9 · Read in context →
What really drove the XL-Smartfren revenue jump — and management's flat-towers, low-single-digit 2026 guide.
Sabrina (analyst); Adam Gifari (Adviser & Group IR): Congrats on the good set of results. Only 2 questions from me. So the first one is we actually noticed a meaningful Q-on-Q increase in the revenue from XL, Smart contracts. Could you share with us more colors on the nature of these deals? And what is actually driving the growth? […] So we – like we said, we relook at what we have. So several of the collections were actually taking place in 4Q and then some additional run rate revenue also incurred during 2025 last quarter, fourth quarter. […] So overall, I think for towers, non-towers combined, we see the company to book basically low single-digit revenue growth, and then EBITDA also and then net profit before we see additional upside.
p. 10 · Read in context →
Earnings quality pressed: asked to normalize out tax volatility, management concedes it can't reliably forecast the rate.
Unknown Analyst; Adam Gifari (Adviser & Group IR): But I think we all recognize that the 2025 result, be it was partly driven by the tax. Can you please quantify normalized full year 2025 earnings if we take out the tax expense volatility and what would be the effective tax rate that we should assume for 2026? […] In 2024, there was a higher tax payment because of different opinions between our management and then tax office in 2024. […] right now, it's, I think, quite normalized tax rate, but no guarantee about that because of – there's always a possibility of different tax opinion between us and tax office.
p. 14 · Read in context →
Unit economics: fiber pricing bottomed, bandwidth-for-price swaps hold revenue, and ~900 staff run 36,000 towers.
Hartono Tanuwidjaja (Director & Chief of Staff); Adam Gifari (Adviser & Group IR): I answer for the fiber – for the pricing for fiber, if relate to the FTTT, I think it's already bottomed. I think we don't see any further decrease on that. For the connectivity, yes, we see that it's very natural the price will go down every year. However, what we do is we don't – we try to maintain the price. Instead of lowering the price, we give them more bandwidth. So the revenue is still remained the same. […] For instance, the number of people operating under towers, even though we were 15,000 towers or 20,000 towers, the headcount on the tower is still 900 people more or less. So that provides a very high tower count per headcount that we have under towers.
p. 20 · Read in context →
PT Sarana Menara Nusantara Tbk.'s annual reports contain management's most considered account of the business. These are the sections, passages and visual pages worth opening in the originals preserved in Sources.
PT Sarana Menara Nusantara Tbk — FY2025 Annual Report — FY2025
Latest report; shows the holding company's shift from pure tower leasing toward a diversified digital-infrastructure group. · Open the full document →
Sekilas SMN / SMN at a Glance — p. 68 · Read the full section →
What the business is: a holding company whose value sits in Protelindo, Indonesia's largest independent tower operator.
Company overview: a holding company whose revenue comes from subsidiary Protelindo and the SMN Group.
SMN’s main business focus is to invest in companies engaged in digital telecommunications infrastructure and other supporting business activities as described below. Given that the majority of SMN’s revenue is derived from the business activities of its subsidiaries, the description of SMN’s business is focused on the integrated operations of PT Profesional Telekomunikas Indonesia (“Protelindo”) and its subsidiaries (“the SMN Group”).
p. 68 · Read in context →
Competitive advantage: largest independent tower operator, neutral because it is unaffiliated with any carrier.
SMN, through its subsidiaries, is the largest independent telecommunications tower owner and operator in Indonesia. In addition to its core business, the Group also develops various supporting business activities related to digital infrastructure development to expand its products and services. As a business group that is neither owned by nor affiliated with any wireless telecommunications operator, Group has a strong competitive advantage as it is able to provide neutral services to all of its customers.
p. 71 · Read in context →
Kegiatan Usaha / Line of Business — p. 74 · Read the full section →
How it makes money — tower leasing plus a widening set of digital-infrastructure and support services.
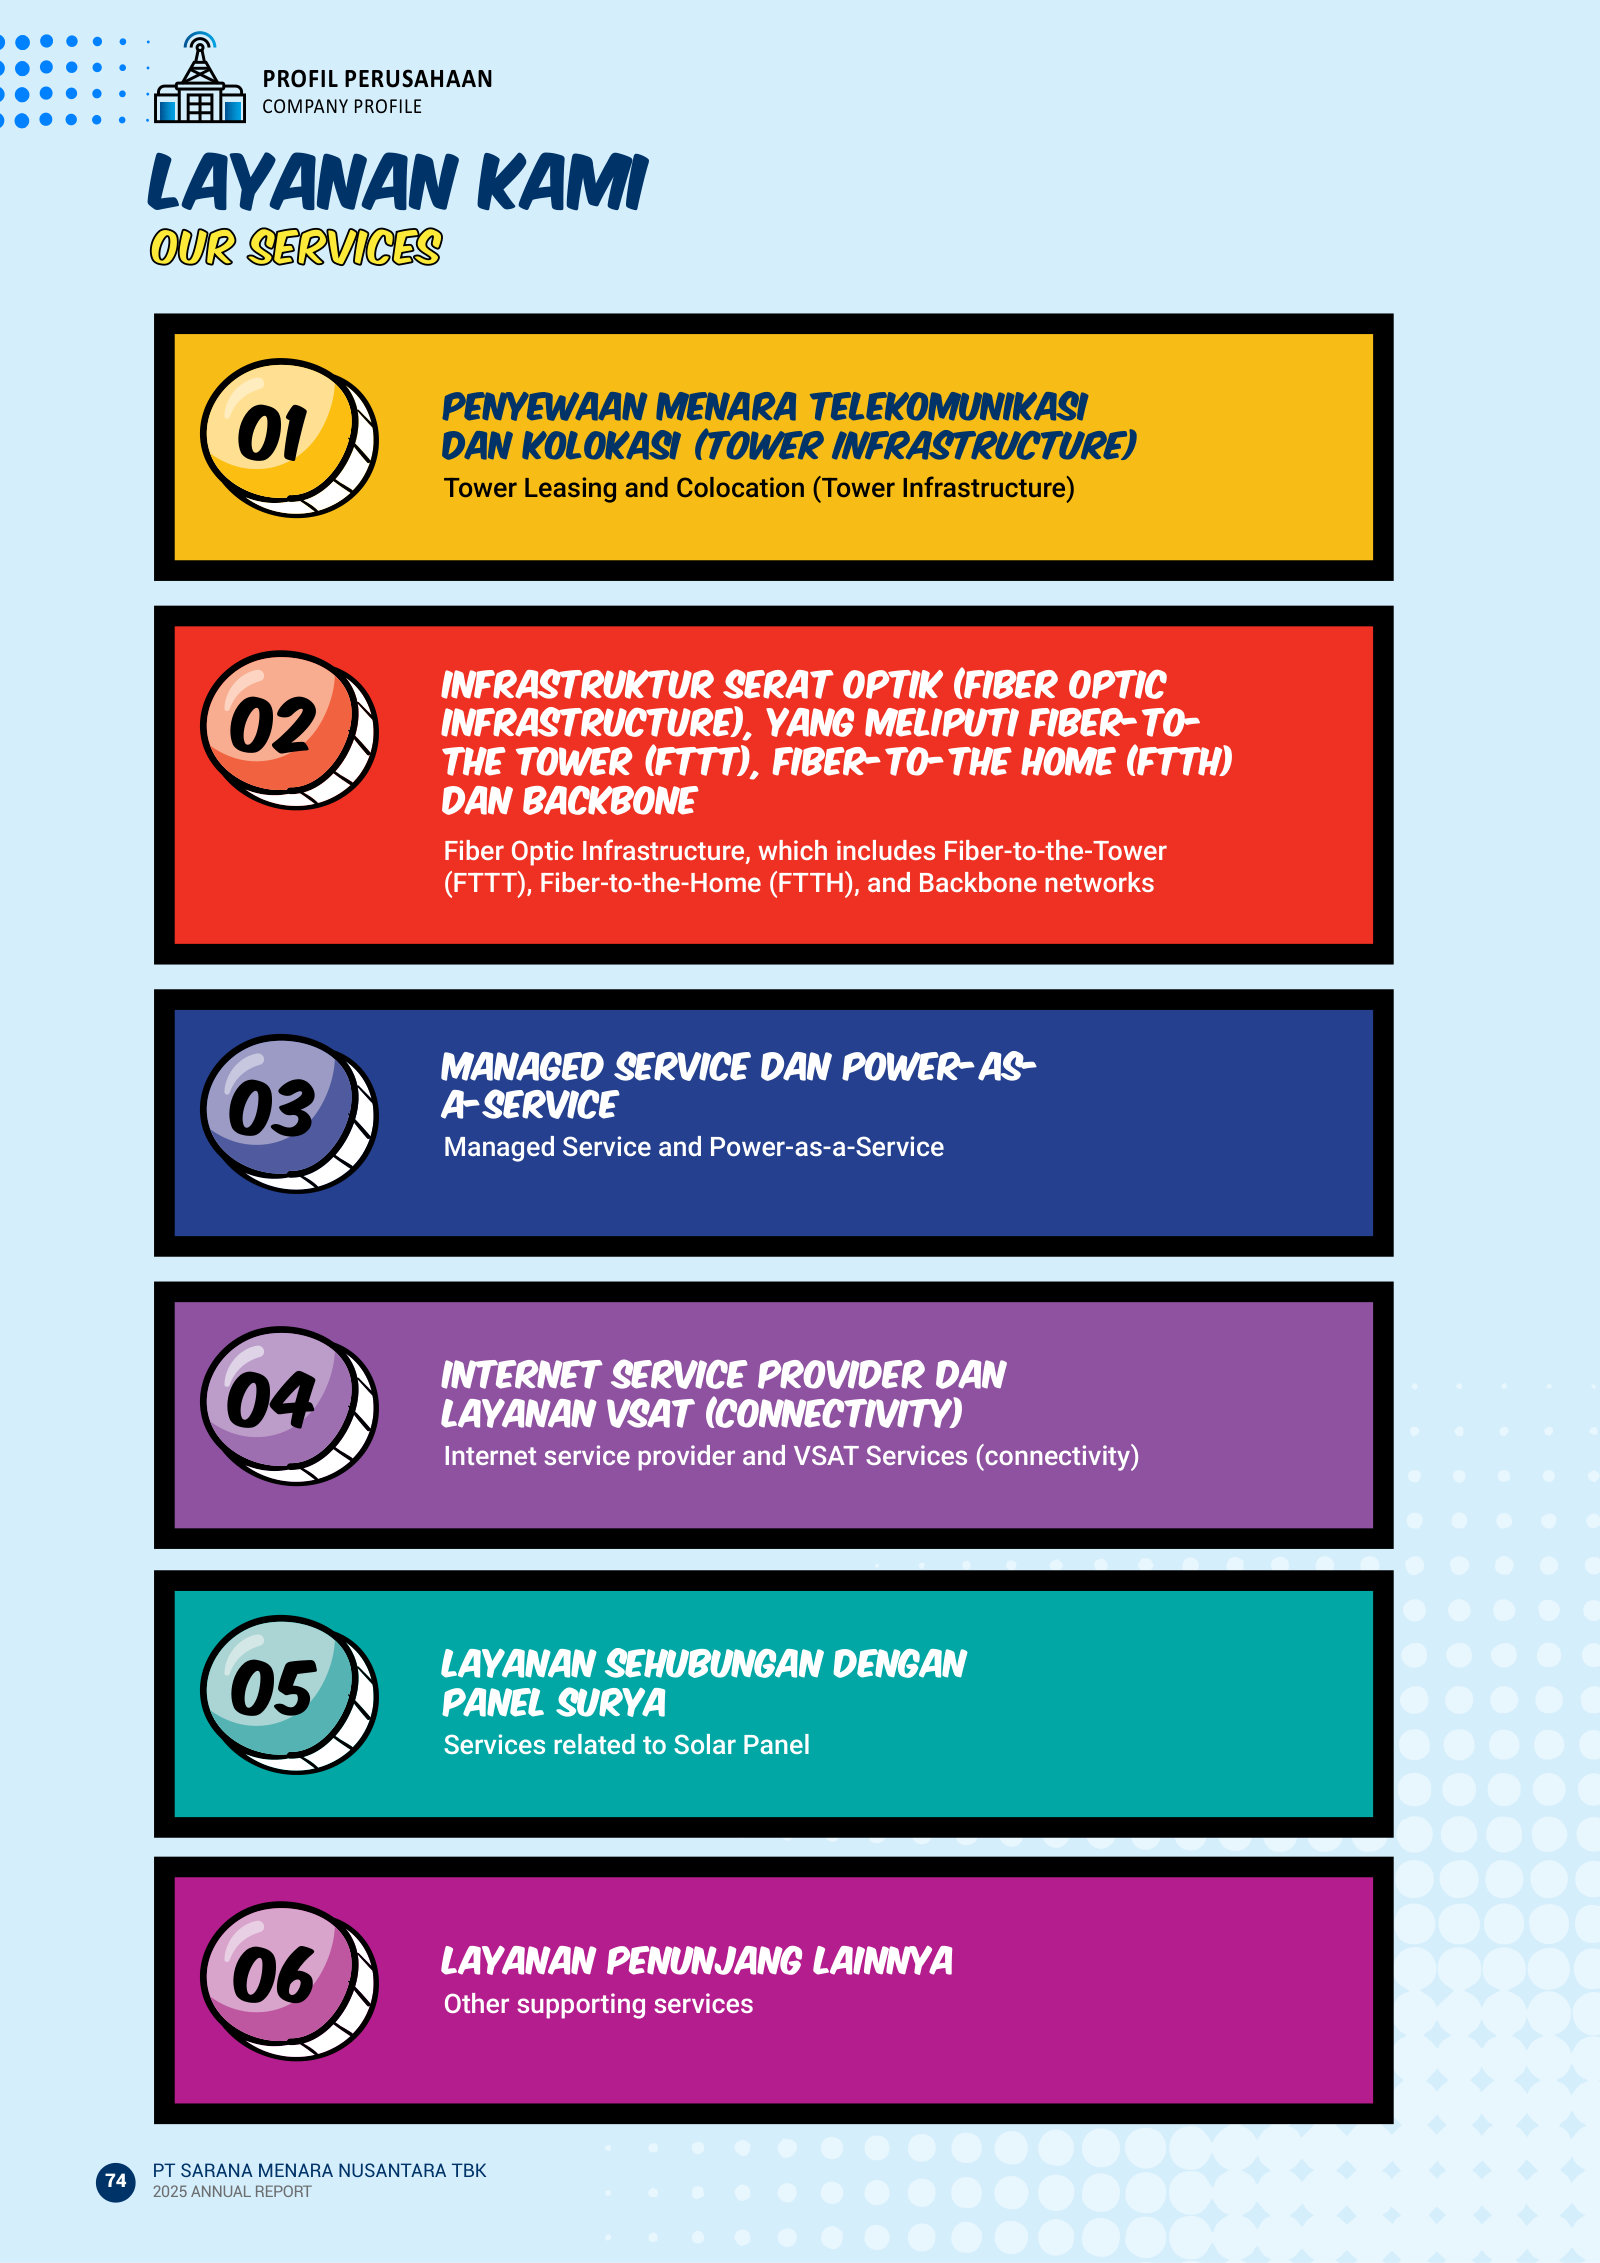
Line of business: holding-company towers plus solar, payments, gensets and fiber construction.
The Company’s current operational focus is on holding company activities and, through its subsidiaries and entities within the Group, providing digital telecommunications infrastructure to its clients. In addition to operating in the provision of digita telecommunications infrastructure, the Group, through its other subsidiaries, also provides services in supporting business sectors, such as renewable energy (solar panels), payment gateway services, business operational support services, sale and leasing of generator sets (gensets), as well as telco infrastructure construction and maintenance services.
p. 74 · Read in context →
Prospek Usaha Tahun 2026 / Business Outlook for 2026 — p. 163 · Read the full section →
Management's forward agenda: 5G, fiber to underserved regions, PaaS, and renewable-energy build-out.
2026 outlook: 5G and fixed-mobile convergence, eastern-Indonesia fiber/subsea, and batteries at 700 tower sites.
SMN is well positioned to support the development of fixed-mobile convergence and the implementation of 5G technology, supported by spectrum allocation and the early stages of monetization. Growth opportunities are also present through the expansion of fiber optic networks and subsea infrastructure, particularly in eastern Indonesia, which remains relatively underserved. […] To support long-term sustainability, SMN will continue to advance its renewable energy initiatives, including the installation of battery systems at 700 tower sites and the deployment of solar panels at both tower sites and non-tower customer locations.
p. 163 · Read in context →
Tinjauan Operasional Segmen Usaha / Business Segment Operational Review — p. 164 · Read the full section →
Splits the group into tower leasing and non-tower, and shows how profit is shared between them.
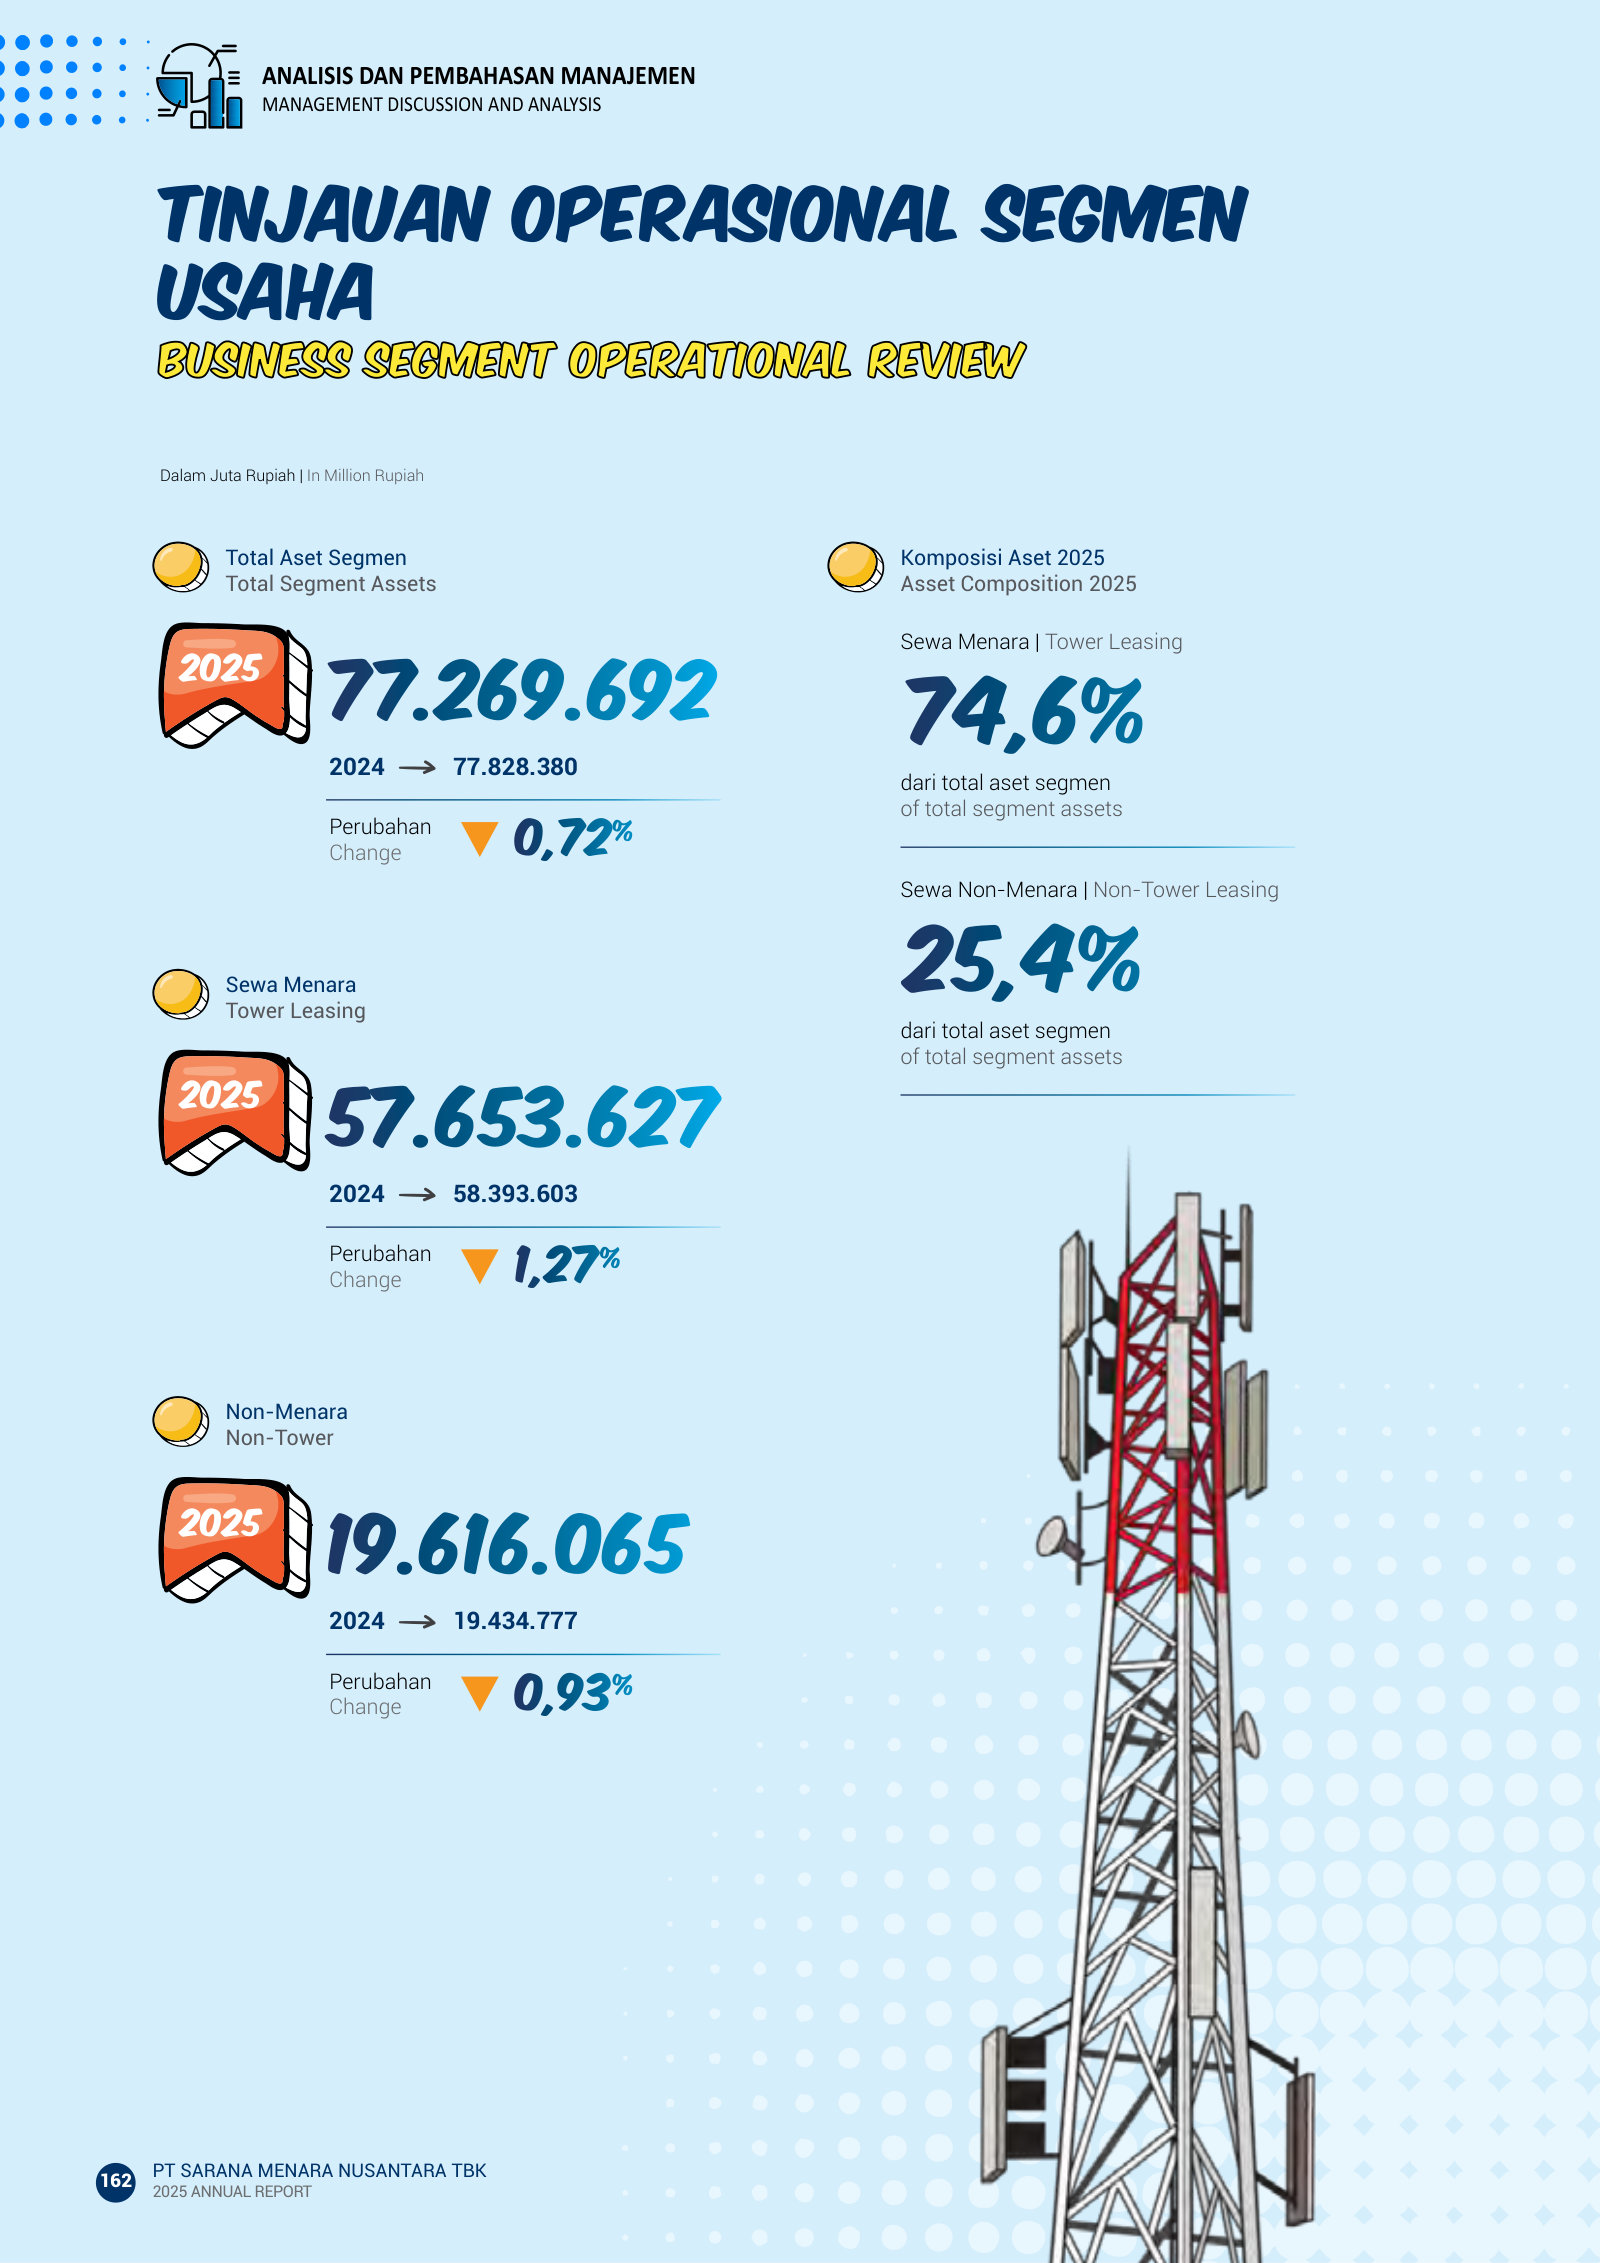
Two segments — tower leasing (69% of gross profit) and non-tower (31%, +14% YTD).
The Company and its Subsidiaries and entities within the Group manage two main business segments, namely tower leasing and fiber optic services for FTTT, FTTH, and connectivity. […] In 2025, the Tower Leasing segment contributed 68.96% of total segment performance and remained the primary contributor to the Company’s gross profit, amounting to Rp6.30 trillion. […] Meanwhile, the Non-Tower segment accounted for 31.04% of gross profit during the same period and recorded a YTD increase of 14.05%.
p. 165 · Read in context →
Tinjauan Keuangan / Financial Review — p. 166 · Read the full section →
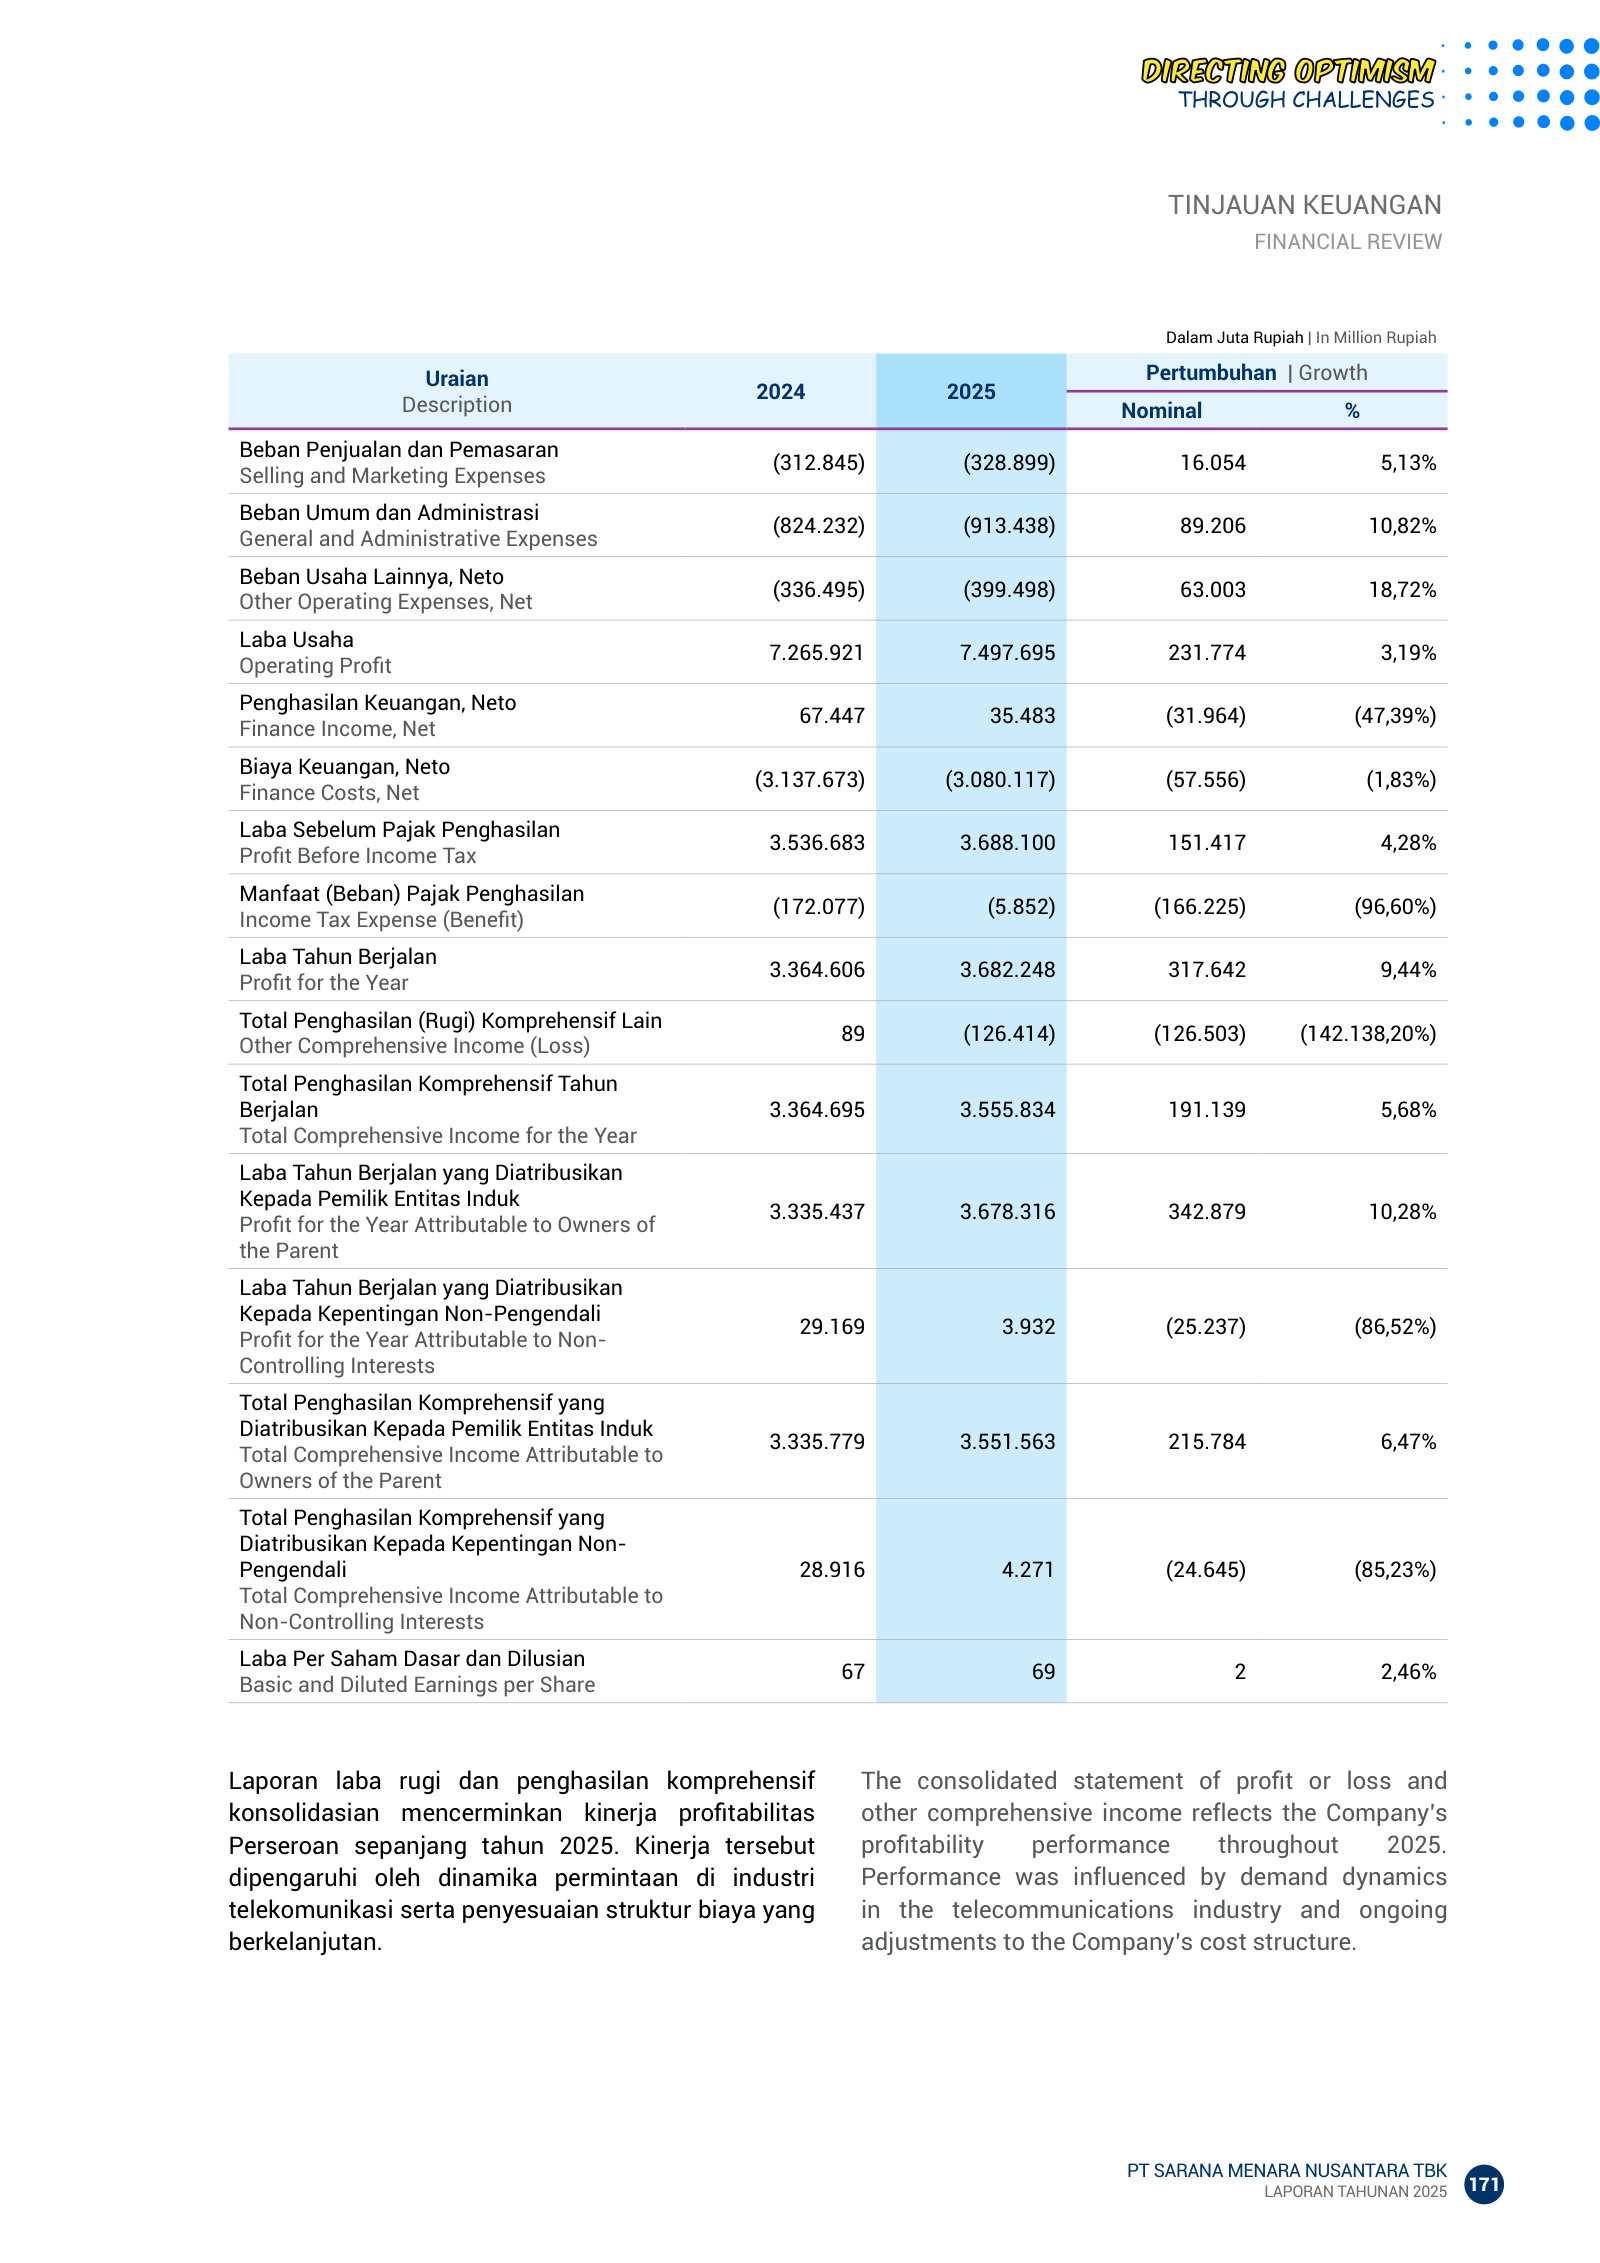
Where management explains 2025 results — revenue +4.65% and heavy reliance on three carrier customers.
Manajemen Risiko / Risk Management — p. 365 · Read the full section →
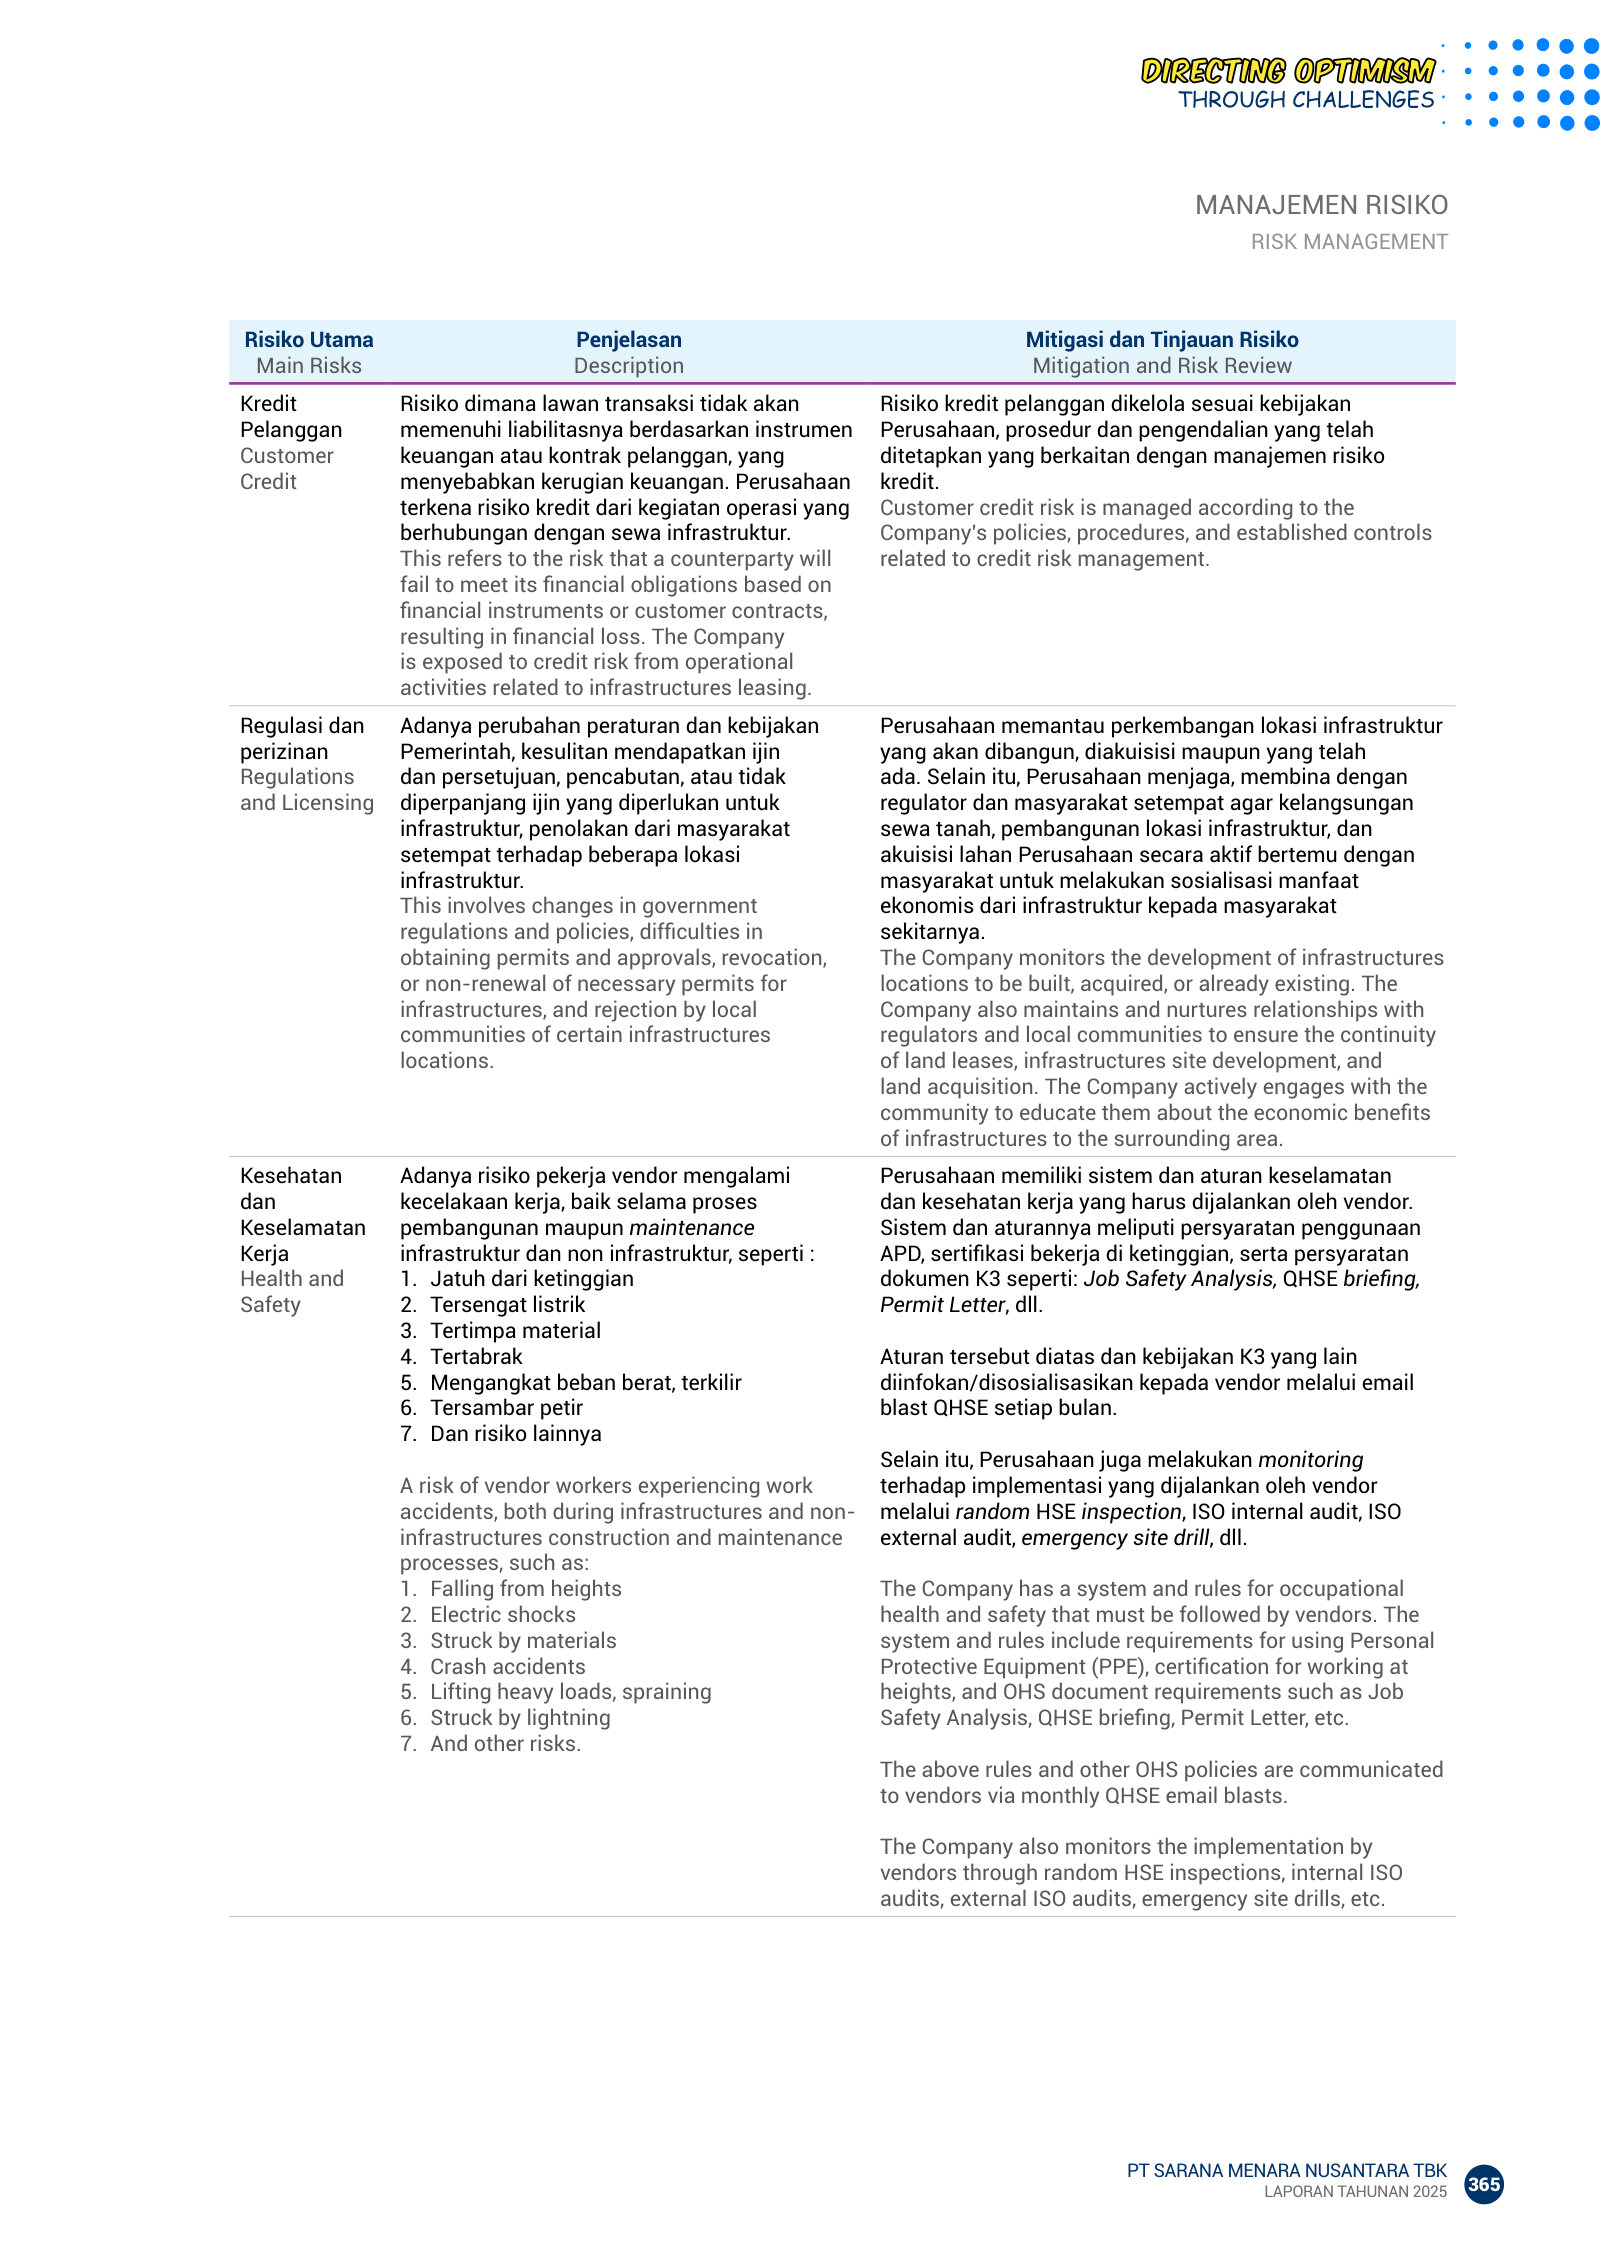
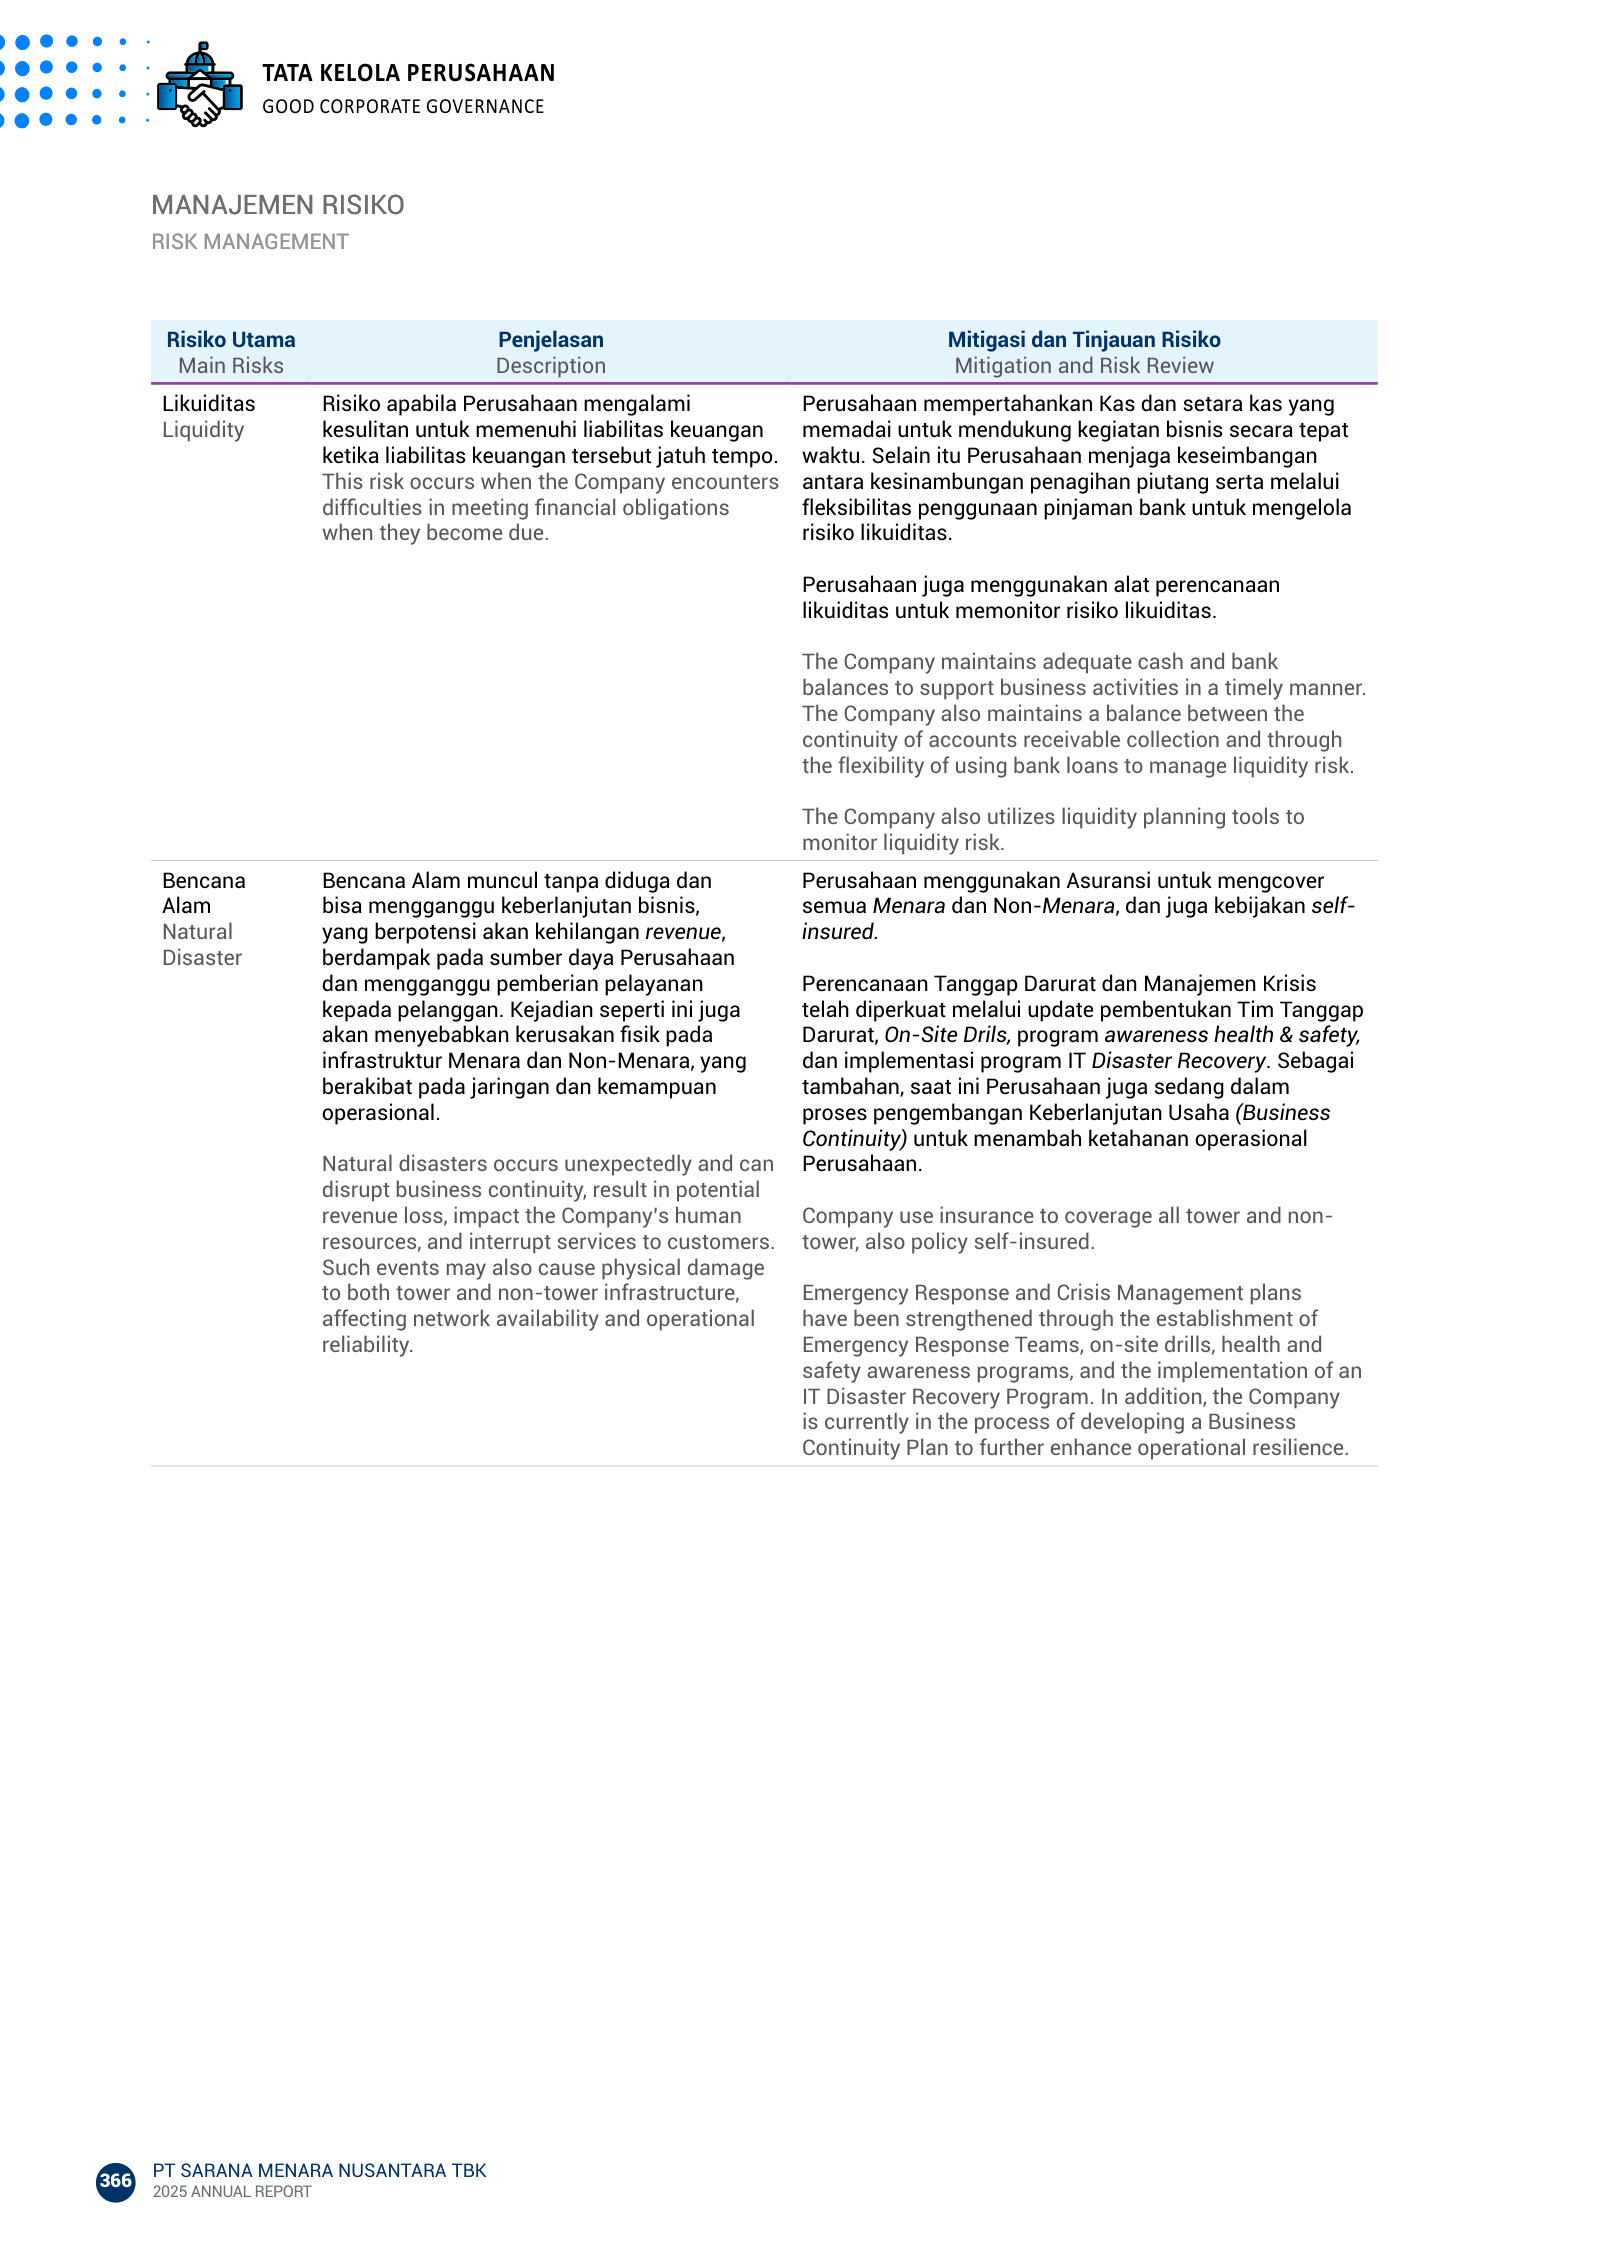
The risks that could genuinely bite a tower operator: carrier credit, licensing/land, and natural disaster.
More annual reports
PT Sarana Menara Nusantara Tbk — FY2024 Annual Report — FY2024 · 318 pages · Prior-year edition ("Synergy & Diversification"); revenue Rp12.74 trillion, the base year for the 2025 comparatives. · Open →
PT Sarana Menara Nusantara Tbk — FY2023 Annual Report — FY2023 · 318 pages · Thinner, tower-centric edition; revenue Rp11.74 trillion — a useful 'before' for the digital-infrastructure pivot. · Open →
Competitors describe PT Sarana Menara Nusantara Tbk.'s market in their own filings and calls. These verified passages and visual pages show where their strategies meet, using source documents preserved in Sources.
PT Tower Bersama Infrastructure Tbk. (TBIG)
The other of Indonesia's 'big two' independent tower companies and Protelindo's most direct competitor — it pursues build-to-suit and colocation tenancies from the same national MNOs (Telkomsel, Indosat, XLSmart). Its filings describe the shared competitive market, a near-identical growth playbook, and the MNO-consolidation dynamic that weighs on both operators' net tenancy adds.
How TBIG frames the market it shares with Protelindo — under a heading 'Indonesia Tower Market Share,' it lists the differentiators that decide tower-leasing wins: location, operator relationships, tower quality, portfolio size and pricing.
The Indonesian tower leasing market is competitive, with key differentiators being tower location, relationships with telecommunications operators, tower quality and height, portfolio size, pricing, operational management, and value-added services.
p. 54 · Read in context →
TBIG's stated growth strategy — build-to-suit construction, tenancy-ratio (colocation) expansion, and portfolio acquisitions from tower companies and operators — mirrors Protelindo's own playbook almost point for point.
Our business growth strategy is comprised of three key components: (i) the construction of additional sites and fiber optic cables on a build-to-suit basis for Indonesian telecommunications operators, (ii) organic growth through expansion of our tenancy ratio, and (iii) growth by acquisition of site portfolios from tower companies and telecommunications operators as well as fiber optic assets.
p. 54 · Read in context →
TBIG's CEO on the FY2025 tenancy slowdown: the XL Axiata–Smartfren merger that formed XLSmart triggered non-renewals of expiring tenancies — the same operator-consolidation pressure that constrains Protelindo's net adds. TBIG closed 2025 with 41,892 tenants and a 1.73x tenancy ratio (reported on the same page).
Hardi Wijaya Liong, CEO of TBIG: For the full year 2025, we added 1,280 gross tenancies, consisting of 797 telecommunication sites and 483 collocations to our portfolio. Following the merger between XL Axiata and Smartfren in March 2025, to form XLSmart, we had some non-renewals on expiring tenancies, which resulted in the lower net tenancy adds for 2025.
p. 5 · Read in context →
PT Dayamitra Telekomunikasi Tbk. (Mitratel) (MTEL)
Telkom's tower arm and the largest tower operator in Indonesia by site count — a direct rival for tower and fiber leasing and for portfolio acquisitions. Its decks contest the very 'largest independent towerco' positioning TOWR claims and quantify a tower- and fiber-wallet-share lead over the other tower providers.
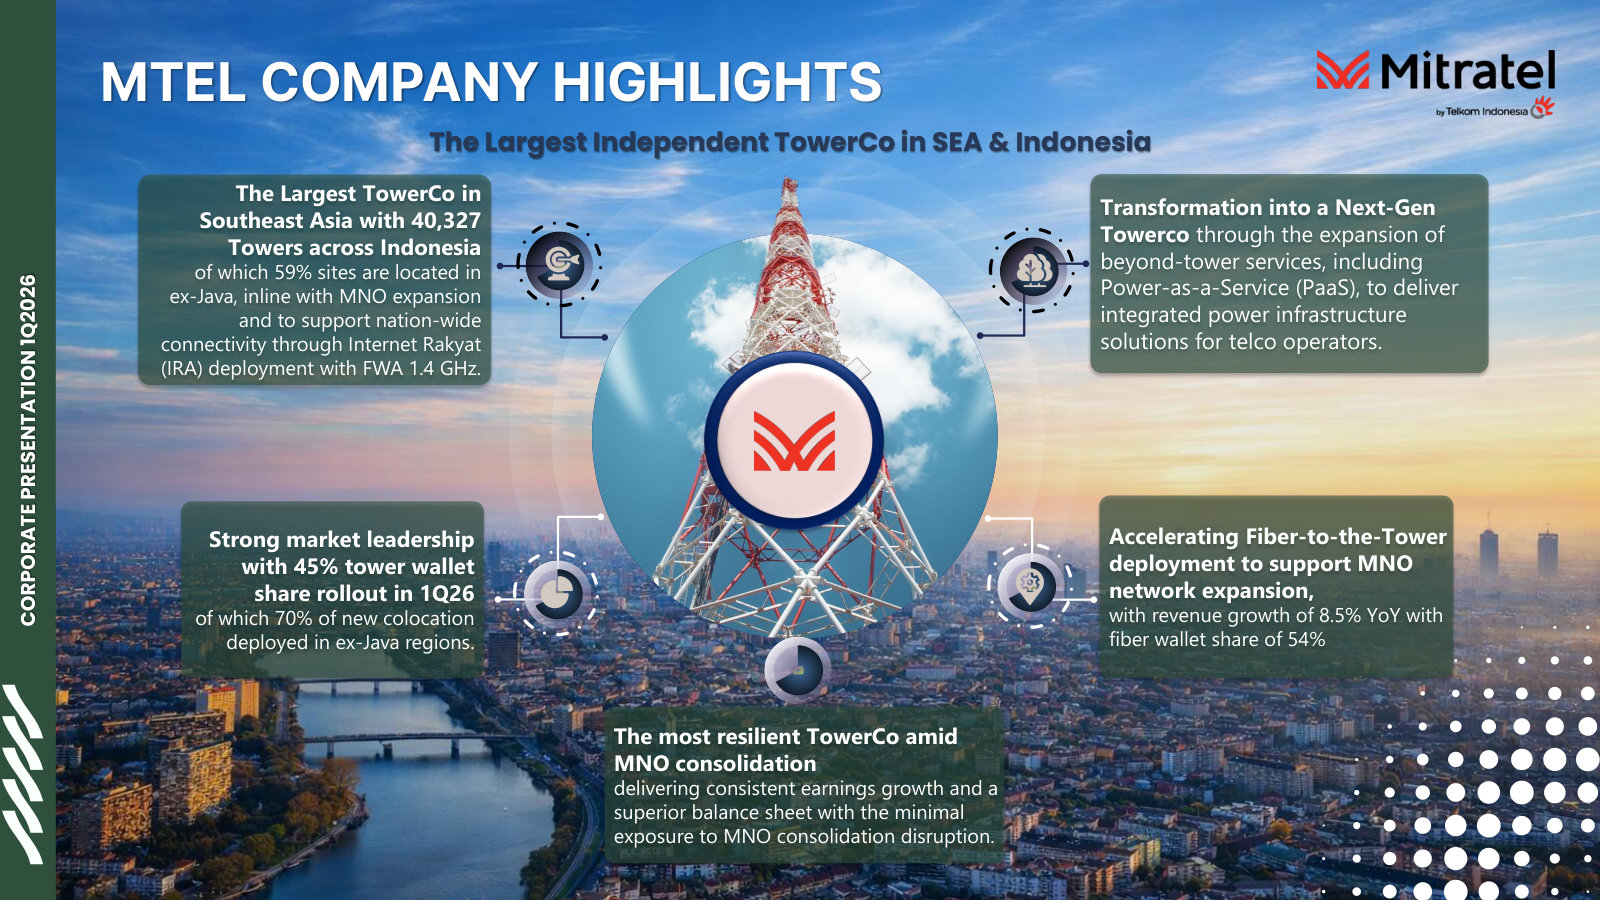
Mitratel's move beyond tower leasing into Power-as-a-Service — an attempt to lift revenue per tower and deepen MNO lock-in that stakes out 'Next-Gen TowerCo' ground TOWR would have to contest.
Power-as-a-Service (PaaS) reflects Mitratel's expansion beyond tower leasing through integrated energy solutions for telecom operators. Through PaaS, Mitratel strengthens its position as a Next-Gen TowerCo by supporting network expansion, operational efficiency, and sustainable connectivity across Indonesia.
p. 11 · Read in context →
PT Gihon Telekomunikasi Indonesia Tbk. (GHON)
A small pure-play Indonesian towerco leasing sites to the same cellular operators. Its value here is how a minor rival sizes the market TOWR leads — explicitly placing itself 'below the industry leader' — and how it frames the MNO-consolidation risk that reshapes tenancy demand for every tower operator.
Gihon benchmarks its 1.67x tenancy ratio against the Indonesian tower-leasing industry and concedes it sits 'below the industry leader' — an implicit nod to Protelindo's superior colocation density.
The Company’s tenancy ratio of 1.67x is in line with the industry average for the Indonesian tower leasing sector in 2025, which ranged between 1.60x and 1.75x. Compared to peers, this level is higher than several major players but still below the industry leader
p. 26 · Read in context →
Gihon's read on competitive intensity: the XL Axiata–Smartfren merger has 'further intensified competition and accelerated industry consolidation,' with market saturation risking pricing pressure and thinner margins across tower operators.
The telecommunications infrastructure industry remains highly dynamic and competitive. The recent merger between XL Axiata and Smartfren, forming XLSmart Telecom Sejahtera, has further intensified competition and accelerated industry consolidation. Slower market growth or market saturation may drive operators to compete aggressively for the same market share, potentially resulting in pricing pressure and reduced profit margins.
p. 39 · Read in context →
More peer documents
Q1_FY2026 — 16 pages · TBIG's latest release with its operating scale as a direct benchmark for Protelindo — 41,764 tenants, 24,666 sites and a 1.70x tenancy ratio, plus a note that Q1 net adds were still dented by XLSmart non-renewals. · Open →
Q3_FY2025 — 19 pages · More detail on XLSmart reconfiguring its network after the merger and the resulting non-renewals — the mechanics of the consolidation drag affecting all towercos. · Open →
Q2_FY2025 — 16 pages · First-half 2025 gross tenancy adds framed against 'the ongoing consolidation of our telecommunication customers' — a two-quarter read on the shared demand environment. · Open →
TBIG_annual_report_FY2024 — 391 pages · Prior-year market overview and customer/geographic mix (revenue split across Telkomsel, Indosat and XL; ~45% of revenue from outside Java-Bali) for a two-year view of the duopoly's footprint. · Open →
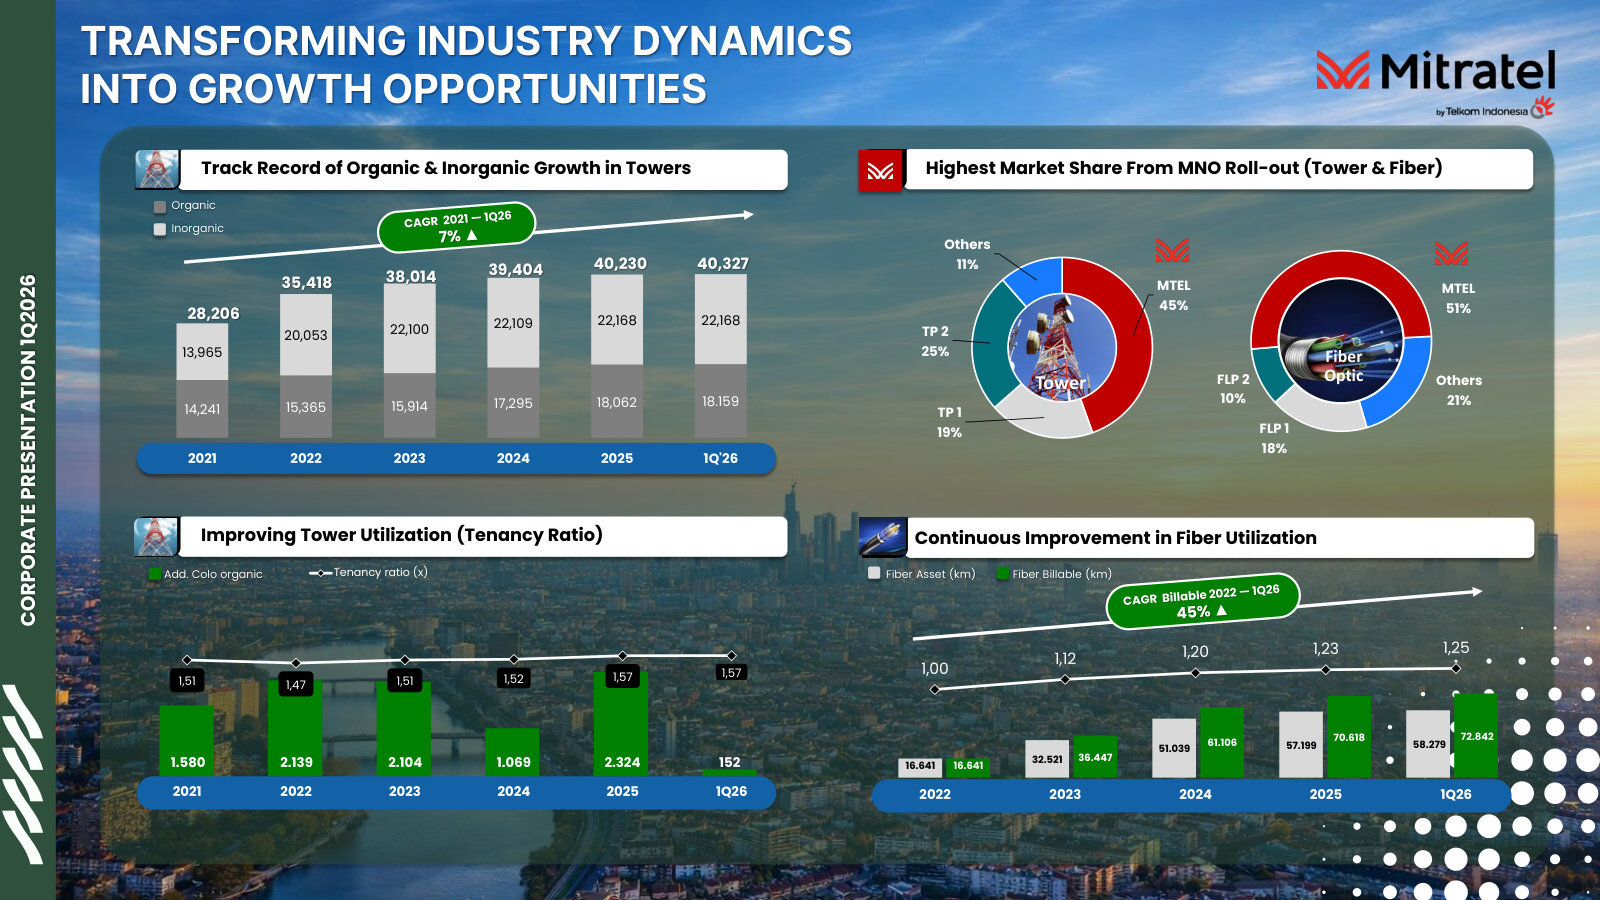
Q4_FY2025 — 14 pages · Mitratel's FY2025 deck with a higher 55% full-year tower wallet share and a wallet-share-by-MNO breakdown (Telkomsel, Indosat/IOH, XLSmart) that shows where rivals hold anchor positions. · Open →
Q3_FY2025 — 13 pages · Earlier deck confirming the market-share and tenancy-ratio claims are persistent quarter to quarter rather than a one-off. · Open →
Q2_FY2025 — 12 pages · Earliest Mitratel deck in the set, useful to trace the tower/fiber wallet-share and tenancy-ratio trend back through 2025. · Open →
GHON_annual_report_FY2024 — 165 pages · Gihon's prior-year risk section citing the Indosat-Hutchison merger as a precedent that cut tenancy ratios across tower providers — a concrete template for the XLSmart consolidation now underway. · Open →
Source: S&P Capital IQ consensus via Xpressfeed · Generated 2026-07-23.
Consensus models low-single-digit revenue growth (~3%/yr) for this Indonesian tower operator, with EBITDA broadly holding but ROE grinding lower every year. Over the past six months the FY2027 normalized-EPS estimate has been trimmed steadily even as the revenue line edged up. The street sits near-uniformly bullish (12 of 13 positive) after a large FY2025 Q4 EPS beat.
FY2027 EPS estimate trimmed ~1.2% in 90 days while revenue nudged up ~1.3%
The FY2027 normalized-EPS consensus has fallen every reading, from 74.0 six months ago to 72.2 today, while revenue moved the other way. FY2028 is essentially flat on both lines.
Currency: IDR · Scale: money in millions, billions, absolute · Point-in-time consensus; Δ90d is Now versus 90d.
| Metric | FY | 180d | 90d | 30d | Now | Δ90d |
|---|---|---|---|---|---|---|
| EPS (normalized) | FY2027 | IDR 74.03 | IDR 73.03 | IDR 72.63 | IDR 72.16 | -1.2% |
| EPS (normalized) | FY2028 | — | IDR 74.96 | IDR 75.20 | IDR 75.20 | +0.3% |
| Revenue | FY2027 | IDR 14,150 | IDR 14,065 | IDR 14,197 | IDR 14,248 | +1.3% |
| Revenue | FY2028 | IDR 14,491 | IDR 14,584 | IDR 14,625 | IDR 14,625 | +0.3% |
Low-single-digit revenue growth, steady EBITDA, ROE grinding lower
Coverage is deepest through FY2028; the ROE step-down is the clearest directional signal across the visible years.
Currency: IDR · Scale: money in millions, billions, absolute · YoY uses the prior fiscal year from the feed; analyst count and range use the first displayed period.
| Metric | FY2026E | FY2027E | FY2028E | YoY | Analysts | Low / high |
|---|---|---|---|---|---|---|
| Revenue | IDR 13,932 | IDR 14,248 | IDR 14,625 | +4.5% | 9 | IDR 13,676 / IDR 14,282 |
| EBITDA | IDR 11,239 | IDR 11,593 | IDR 11,821 | +2.4% | 13 | IDR 10,585 / IDR 12,093 |
| EPS (normalized) | IDR 68.96 | IDR 72.16 | IDR 75.20 | -0.1% | 13 | IDR 63.00 / IDR 82.42 |
| ROE | 14.3% | 13.5% | 12.5% | -1.5pt | — | — |
Mixed EPS record: early misses, then a striking +23% Q4 FY2025 beat
Current sequences by metric: Revenue: 1 consecutive miss; EPS (normalized): 4 consecutive beats.
Currency: IDR · Scale: money in millions, billions, absolute · Consensus is captured before each actual first became effective.
| Quarter | Metric | Consensus | Actual | Surprise | Outcome |
|---|---|---|---|---|---|
| Q4 FY2025 | EPS (normalized) | IDR 16.24 | IDR 20.00 | +23.2% | Beat |
| Q2 FY2025 | Revenue | IDR 3,241 | IDR 3,186 | -1.7% | Miss |
| Q4 FY2024 | EPS (normalized) | IDR 16.93 | IDR 17.00 | +0.4% | Beat |
| Q3 FY2024 | EPS (normalized) | IDR 17.73 | IDR 18.00 | +1.5% | Beat |
| Q2 FY2024 | EPS (normalized) | IDR 15.65 | IDR 16.00 | +2.3% | Beat |
| Q1 FY2024 | EPS (normalized) | IDR 17.23 | IDR 16.00 | -7.1% | Miss |
| Q4 FY2023 | EPS (normalized) | IDR 18.15 | IDR 16.00 | -11.8% | Miss |
| Q3 FY2023 | Revenue | IDR 2,935 | IDR 2,943 | +0.3% | Beat |
| Q3 FY2023 | EPS (normalized) | IDR 18.48 | IDR 18.00 | -2.6% | Miss |
Street snapshot
Currency: IDR · Scale: money in millions, billions, absolute · Analyst counts shown explicitly.
| Street view | Reading | Analysts |
|---|---|---|
| Recommendation mix | Buy 9, Outperform 3, Hold 1, Underperform 0, Sell 0 | 13 |
| Consensus score | 1.38 | 13 |
| Target price | mean IDR 684.6; median IDR 660.0; high IDR 950.0; low IDR 390.0 | 13 |
Where analysts split: normalized EPS in FY2026 and FY2028, EBITDA in FY2027
Currency: IDR · Scale: money in millions, billions, absolute · Spread/mean is absolute high-low divided by absolute mean.
| Metric | Period | Mean | Low–high | Spread/mean | Analysts |
|---|---|---|---|---|---|
| EPS (normalized) | FY2026E | IDR 68.96 | IDR 63.00–IDR 82.42 | 28.2% | 13 |
| EBITDA | FY2027E | IDR 11,593 | IDR 10,851–IDR 12,663 | 15.6% | 13 |
| EPS (normalized) | FY2028E | IDR 75.20 | IDR 68.00–IDR 84.32 | 21.7% | 8 |
Visible Alpha broker models via S&P Xpressfeed · 8 brokers · 306 line items · freshest revision 2026-06-11.
Broker models cast TOWR as a mature Indonesian tower operator: near-consensus on the headline P&L, with revenue holding around Rp13.3T and EBITDA flat near Rp11T through FY-2028. The debate is not the top line but the mix and the cash: non-tower revenue is now the faster-growing ~40% of sales, tower-leasing KPIs are decelerating, and brokers split widely on capex, free cash flow and the dividend. Forward coverage thins sharply, from eight brokers in FY-2025 to two-to-three thereafter.
Non-tower revenue is the modeled swing factor as tower leasing flattens near Rp8.4T
Only two brokers split tower from non-tower, so treat the mix as indicative. On those models tower leasing is roughly flat around Rp8.4T while non-tower revenue compounds in the mid-single digits, making it the marginal driver of total growth.
| Line | FY-2025A | FY-2026E | FY-2027E | FY-2028E | YoY | Brokers |
|---|---|---|---|---|---|---|
| Total revenue | Rp13,328.62bn | Rp13,845.45bn | Rp14,146.75bn | Rp14,460.88bn | +3.9% | 8 |
| Revenue - tower | Rp9,105.16bn | Rp8,354.35bn | Rp8,449.27bn | Rp8,559.71bn | -8.2% | 6 |
| Revenue - non tower | — | Rp5,511.86bn | Rp5,720.18bn | Rp5,901.17bn | — | 2 |
Tenant growth decelerates and the tenancy ratio plateaus near 1.66
Ending tenants step up in FY-2026 then flatten toward 63,000, with the tenancy ratio settling around 1.66 and annualised revenue per tenant broadly flat near Rp230M. Growth increasingly leans on colocations onto existing sites rather than new-site builds.
| Line | FY-2025A | FY-2026E | FY-2027E | FY-2028E | YoY | Brokers |
|---|---|---|---|---|---|---|
| Volume | — | — | — | — | — | — |
| Ending tenants(#) | 58,339 Number | 61,457 Number | 62,630 Number | 63,000 Number | +5.3% | 8 |
| Ending sites(#) | 36,238 Number | 36,897 Number | 37,530 Number | 37,997 Number | +1.8% | 8 |
| Utilisation | — | — | — | — | — | — |
| Tenancy ratio(#) | 1.60 Number | 1.66 Number | 1.67 Number | 1.65 Number | +3.9% | 7 |
| Volume | — | — | — | — | — | — |
| Net adds-tenant(#) | 716.6 Number | 1,375 Number | 1,173 Number | 1,075 Number | +91.9% | 5 |
| Unit economics | — | — | — | — | — | — |
| Revenue per tenant-Annualised | Rp229.88m | Rp226.97m | Rp228.02m | Rp231.45m | -1.3% | 8 |
EBITDA holds near Rp11T while easing capex funds a step-up in the dividend
EBITDA is modeled essentially flat around Rp11T. With capital expenditure easing from above Rp5T toward the low Rp4T range, brokers carry EPS drifting up toward Rp72 and a dividend that steps up from roughly Rp20 to Rp24 per share.
| Line | FY-2025A | FY-2026E | FY-2027E | FY-2028E | YoY | Brokers |
|---|---|---|---|---|---|---|
| EBITDA | Rp11,125.96bn | Rp11,093.50bn | Rp11,315.38bn | Rp11,453.08bn | -0.3% | 8 |
| Capital expenditure | Rp5,150.78bn | Rp4,464.77bn | Rp4,314.32bn | Rp4,617.35bn | -13.3% | 6 |
| EPS-Diluted(IDR) | Rp65.47 | Rp66.63 | Rp69.25 | Rp71.59 | +1.8% | 8 |
| Dividend per share(IDR) | Rp20.02 | Rp23.71 | Rp23.57 | Rp23.34 | +18.4% | 8 |
Consensus is tight on revenue but splits widely on capex, free cash flow and payout
Revenue and EBITDA sit inside a narrow band, but the models diverge on how much TOWR invests and returns. Capex, free cash flow and the dividend show the widest FY-2025 dispersion despite eight-broker coverage.
| Line | Period | Median | Q1–Q3 | Min–max | Brokers |
|---|---|---|---|---|---|
| Capital expenditure | FY-2025A | Rp5,367.07bn | Rp4,172.78bn–Rp6,513.47bn | Rp2,562.13bn–Rp6,938.13bn | 6 |
| Free cash flow (FCF) | FY-2025A | Rp2,666.30bn | Rp1,944.83bn–Rp5,462.12bn | Rp-511.31bn–Rp6,692.84bn | 6 |
| Dividend per share(IDR) | FY-2025A | Rp20.56 | Rp15.97–Rp22.21 | Rp13.82–Rp27.17 | 8 |
| Net adds-sites(#) | FY-2025A | 928.0 Number | 617.0 Number–1,425 Number | 400.0 Number–2,440 Number | 8 |
Forward coverage thins to two-to-three brokers; the revenue split rests on two
Eight brokers model FY-2025, but only two to three carry FY-2026 through FY-2028. The tower/non-tower split, colocation counts and free cash flow rest on one or two models, so read forward-year and segment figures as thin rather than settled consensus.
Headline P&L consensus, momentum and beat/miss live in the CapIQ tab.
Source: S&P Capital IQ transcripts via Xpressfeed · latest indexed call 2026-06-03 · generated 2026-07-23.
Latest call digest
PT Sarana Menara Nusantara Tbk., PT Verdhana Sekuritas Indonesia, Q1 2026 Earnings Call, Jun 03, 2026 · 2026-06-03T07:00:00
Q1 2026 call (June 3, 2026). Adam Gifari's prepared remarks leaned on the familiar scale story — 36,000+ towers, roughly 180,000 km of build-to-suit fiber, a stable 8% return on investment — and framed 2026 growth as coming mainly from connectivity. The Q&A was more pointed. Analysts pressed on the per-tenant tower lease rate drifting toward the industry level (management put it at a step down from IDR 11 million to IDR 10.5 million, tied to the XL-Smartfren deal and a roughly 10-year contract reset), on FTTH revenue slipping even as penetration reached a record 15.8% (management: wholesale minimum-guarantee contracts still running below take-up), and on CapEx exceeding depreciation without matching EBITDA growth (management: waiting on higher co-location tenancy). Stated guidance was about IDR 14 trillion of 2026 revenue, an EBITDA margin in the mid-70s to 78%, and an unchanged dividend. The call also marked Gifari's last as IR lead, with Hartono Tanuwidjaja taking over.
Participant coverage from the latest call.
| Group | Participants | Count |
|---|---|---|
| Management | Operator; Adam Gifari; Hartono Tanuwidjaja — Chief of Strategic Business Development, PT Sarana Menara Nusantara Tbk. | 3 |
| Analysts | Erwin Wijaya — Analyst, PT Verdhana Securities Indonesia | 1 |
Curated latest-call exchanges; one row per analyst topic.
| Analyst | Firm | Topic | What changed in Q&A |
|---|---|---|---|
| Sabrina | Trimegah Sekuritas | Tower lease-rate decline | Asked why average lease rate fell to a historic low. Management attributed it to the XL-Smartfren merger deal, quantifying a move from IDR 11 million to IDR 10.5 million, offset by a roughly 10-year contract reset and added fiber orders. |
| Sabrina | Trimegah Sekuritas | FTTH penetration vs. flat revenue | Flagged record penetration but declining FTTH revenue. Management explained that 95%+ of home passes are wholesale build-to-suit for XL and Indosat, priced on minimum guarantees the take-up has not yet exceeded. |
| — | — | Capital allocation and buyback | Anonymous question on buyback versus dividend, debt paydown and building. Management said 2026 is a year of CapEx/OpEx discipline and debt-cost reduction, noted a buyback was done in Q1, and favored a mix. |
| — | — | CapEx vs. depreciation and ROIC/ROE trough | Asked why CapEx above depreciation is not lifting EBITDA and when returns bottom. Management said it is a function of higher asset utilization and co-location tenancy, held back by post-merger consolidation. |
| Vincent Gozali | — | FWA (SURGE/WIFI/MyRepublic) tenant additions | Asked the run rate of fixed-wireless-access site leases. Management said demand rose from about 400 before Lebaran to more than 1,000 leases now, all provided as colocation on existing towers. |
Theme tracker
Themes are curator-classified across supplied calls.
| Theme | Status | Quarters mentioned | Read-through |
|---|---|---|---|
| Connectivity as the designated growth engine | persisted | Q3 2024, FY2024, Q1 2025, Q2 2025, FY2025, Q1 2026 | With tower and fiber-to-the-tower orders flat through the mergers, management repeatedly named connectivity (enterprise/B2B plus ISP subsidiaries) the organic bright spot. It recurs in every recent call as the main lever for top-line growth. |
| Merger relocations and lease churn (IOH then XL-Smartfren) | persisted | 9M 2023, FY2023, Q2 2024, Q3 2024, FY2024, Q1 2025, Q2 2025, FY2025, Q1 2026 | Indosat-Hutchison relocations dominated 2023-2025, with the XL-Smartfren merger overlapping from 2024. By Q1 2026 management called XLS the last meaningful hit to tower revenue. |
| Soft tower revenue and eroding tenancy ratio | persisted | FY2023, Q2 2024, Q3 2024, FY2024, Q1 2025, Q2 2025, FY2025, Q1 2026 | Tenancy ratio drifted from about 1.78 to the mid-1.6s as towers grew faster than tenants; tower revenue ran flat to negative, printing minus 4.1% in Q1 2026. |
| FTTH monetization gap — rising penetration, flat revenue | emerged | Q2 2025, FY2025, Q1 2026 | Analysts increasingly flagged FTTH revenue falling even as penetration hit records. Management pointed to wholesale minimum-guarantee contracts sitting below take-up. This is a newer, distinct concern versus the earlier growth-story framing. |
| Rights issue overhang | dropped | Q2 2024, Q3 2024, FY2024, Q1 2025, Q2 2025 | The roughly IDR 5.5 trillion rights issue was a standing Q&A topic until it completed in mid-2025. It is absent as a forward item in the FY2025 and Q1 2026 calls because it resolved, not because it went unexplained. |
| 5G and spectrum-auction anticipation | persisted | 9M 2023, FY2023, Q3 2024, FY2024, Q1 2025, Q2 2025, FY2025, Q1 2026 | Raised in nearly every call yet perennially deferred; by Q1 2026 management still described Indonesia as essentially a 4G country with no spectrum-auction timeline. |
| Fiber/ISP M&A consolidation | persisted | FY2023, Q3 2024, FY2024, Q1 2025, Q2 2025, FY2025, Q1 2026 | Successive acquisitions — IBST towers, then fiber ISPs such as Varnion, Nusanet and Remala — aimed at lifting fiber utilization. Management consistently described the pipeline as ongoing without naming targets. |
Guidance ledger
Quotes, calls, and speakers are source-verified; outcomes are curator-classified.
| Verbatim guidance | Call | Speaker | Curator outcome | Outcome note |
|---|---|---|---|---|
| “revenue for 2025 is expected to be in the low single digits organically compared to 2024 achievements.” | PT Sarana Menara Nusantara Tbk., 2024 Earnings Call, Mar 26, 2025 · 2025-03-26T07:00:00 | Adam Gifari | kept | FY2025 audited operating revenue reached IDR 13.3 trillion, a low-single-digit rise, in line with the guided range. |
| “I think we expect to see lower to 83%” | PT Sarana Menara Nusantara Tbk., Q1 2025 Earnings Call, Jun 16, 2025 · 2025-06-16T07:00:00 | Adam Gifari | kept | FY2025 EBITDA of IDR 10.97 trillion on IDR 13.3 trillion revenue implies a margin close to the guided low-83% area. |
| “we see the company to book basically low single-digit revenue growth” | PT Sarana Menara Nusantara Tbk., 2025 Earnings Call, Apr 06, 2026 · 2026-04-06T09:00:00 | Adam Gifari | pending | 2026 outlook; the Q1 2026 call pointed to about IDR 14 trillion revenue, roughly consistent with low-single-digit growth off IDR 13.3 trillion. |
| “CapEx should be around IDR 5 trillion.” | PT Sarana Menara Nusantara Tbk., 2025 Earnings Call, Apr 06, 2026 · 2026-04-06T09:00:00 | Adam Gifari | pending | 2026 CapEx guidance; no full-year 2026 figure available in the supplied call history. |
| “we're achieving IDR 14 trillion of revenues and then EBITDA to be mid-70s or 78%” | PT Sarana Menara Nusantara Tbk., PT Verdhana Sekuritas Indonesia, Q1 2026 Earnings Call, Jun 03, 2026 · 2026-06-03T07:00:00 | Adam Gifari | pending | Full-year 2026 revenue and EBITDA-margin framing given on the latest call; no subsequent quarter available to test it. |
| “We budgeted the same dividend as last year” | PT Sarana Menara Nusantara Tbk., PT Verdhana Sekuritas Indonesia, Q1 2026 Earnings Call, Jun 03, 2026 · 2026-06-03T07:00:00 | Adam Gifari | pending | 2026 dividend intention, subject to a better-than-expected business case; not yet resolved in the supplied history. |
Q&A pressure map
Question counts and firms are curator tallies; analyst coverage shown above.
| Topic | Questions | Firms | Pressure / response |
|---|---|---|---|
| Merger churn and tower relocations | 6 | Trimegah Sekuritas, Mandiri Sekuritas, Citigroup, BCA Sekuritas | The most-pressed topic across quarters. Management engaged in detail, walking through churn scenarios and relocation progress rather than deflecting. |
| Multi-year revenue and EBITDA growth outlook | 3 | DBS Bank, Bahana Sekuritas, Verdhana | Management repeatedly declined firm long-term forecasts, citing the build-to-suit model driven by operator orders. A consistent, openly stated limit rather than an evasion. |
| Tower lease-rate / ARPU decline | 3 | Trimegah Sekuritas, JPMorgan, BCA Sekuritas | Analysts pressed on falling per-tenant lease rates over several calls; in Q1 2026 management tied the step-down to the XL-Smartfren deal and a roughly 10-year contract reset. |
| FTTH revenue vs. penetration disconnect | 2 | Trimegah Sekuritas | In Q2 2025 management could not reconcile the quarter-on-quarter FTTH revenue drop on the call and pointed to home-connect volume instead — a candid but partial non-answer, later addressed via the minimum-guarantee explanation. |
| Tax-rate volatility and normalized earnings | 2 | Bahana Sekuritas, Citigroup | Management declined to quantify a normalized tax rate, citing unpredictable tax-office positions and a new tax system. |
Language shifts
Only language evidence verified against the referenced component is shown.
| Observation | Verbatim evidence | Call ID | Component |
|---|---|---|---|
| A new macro-risk vocabulary centered on the Middle East 'war', oil prices, inflation and a weaker rupiah entered the caution set in 2026, displacing the earlier interest-rate-only framing. | “The recent war, increased oil prices, high inflation and now we are seeing weaker rupiah” | 2003367193 | 6 |
| Management's tone on 5G turned notably more candid and tempered, downplaying current 5G rather than promoting it as a near-term driver. | “Indonesia doesn't have a 5G yet. It's more of a gimmick.” | 2003367193 | 2 |
| Persistent 'waiting' language around a tower-demand rebound signals sustained caution about the timing of any recovery in tenancy and pricing. | “We are obviously waiting for the inflection point.” | 1945628439 | 44 |
The through-line across these calls is a company absorbing two overlapping telco mergers by trading near-term tower softness for longer contracts and leaning on connectivity for growth. The newer notes — a candid 5G-is-still-4G stance, a fresh war/inflation caution, and an unresolved FTTH revenue-versus-penetration gap — argue for treating management's low-single-digit growth framing as the realistic base case until tenancy ratios actually inflect.
Business and Balance Sheet
PT Sarana Menara Nusantara (TOWR) is the largest of Indonesia's listed tower operators by revenue: a holding company whose one real asset is Protelindo, a portfolio of 36,247 towers leased to the country's mobile carriers under long-term, non-cancellable contracts. In FY2025 it earned Rp13.3 trillion of revenue at an 82% EBITDA margin and Rp3.7 trillion of net profit. Once a growth-stock favourite, the shares now trade near multi-year lows around six times earnings, after a 2025 recapitalization that cut leverage and lifted the controlling family's stake.
What the company owns
TOWR is a holding structure, not an operating business in its own right. Its principal asset is a 99.99% stake in PT Profesional Telekomunikasi Indonesia — Protelindo — which has run towers commercially since 2003 [1]. Protelindo owns steel and land, and rents vertical space on each tower to wireless operators. The model is a landlord's: at the end of 2025 the group carried 36,247 towers and roughly 185,000 km of fibre-optic network (including associate DATA), and describes the bulk of its business as sitting on non-cancellable long-term contracts that produce "predictable and recurring" cash flows [2].
The economics of that model turn on two numbers: how many towers you own, and how many tenants sit on each one. TOWR ended 2025 with 60,500 tenants across its towers — a tenancy ratio of 1.67 — with 53% of towers located in Java [3]. Because the incremental tenant on an existing tower costs the operator almost nothing to add, that ratio is the primary lever on margins; at 1.67 it sits below peers, which is either unused capacity or a structural limit, depending on where the industry goes.
Within Indonesia, TOWR is one of two clear leaders. By revenue its Rp13.3 trillion dwarfs the Rp6.9 trillion of listed peer Tower Bersama (TBIG) [4]. By tower count it runs second to state-linked Mitratel (MTEL), which reported 40,230 towers at year-end against TOWR's 36,247 [5]. Tower Bersama ended the year with 24,212 towers and 41,892 tenants [6].
Sources: TOWR Q4 FY2025 call [7]; Mitratel Q4 FY2025 [8]; Tower Bersama FY2025 AR [9].
How much it earns
The three-year record is one of steady, unspectacular growth. Revenue rose from Rp11.7 trillion in FY2023 to Rp13.3 trillion in FY2025 — about 6.5% a year — while EBITDA climbed from Rp10.0 trillion to Rp11.0 trillion and net profit from Rp3.3 trillion to Rp3.7 trillion [10]. FY2025 profit of Rp3.68 trillion was up 9.4% on the prior year [11].
FY2025 Revenue (Rp bn)
EBITDA Margin
FY2025 Net Profit (Rp bn)
Source: FY2025 Annual Report, Financial Highlights [12].
The margin is the striking part. EBITDA margins ran 85.0% / 84.0% / 82.3% across the three years, and net margin held near 27% [13]. The slow drift down in the EBITDA margin is worth flagging — it coincides with expansion into lower-margin fibre and non-tower services — but a business converting more than four-fifths of revenue into EBITDA is, structurally, a high-quality one. The steadiness matters more than the level for a landlord: it is what a book of non-cancellable leases is supposed to deliver.
Source: FY2025 Annual Report, Financial Highlights [14].
Who controls it
TOWR is a controlled company. At the end of 2025, two vehicles associated with the Hartono family — Indonesia's wealthiest, owners of the Djarum group and controlling shareholders of Bank Central Asia — held a combined 65.2% of the 59.1 billion shares outstanding: PT Sapta Adhikari Investama with 45.3% and PT Dwimuria Investama Andalan with 20.0% [15]. The public float is roughly a third; management holds only token stakes.
The interesting move sits between the two years. A year earlier the same family vehicles held 60.0% (Sapta 54.4%, Dwimuria 5.6%) of a smaller 51.0 billion-share base [16]. In 2025 the company issued roughly 8 billion new shares through a rights offering; the family took up almost all of them, raising its combined holding by about five percentage points while the share count grew. That is the opposite of a controlling owner cashing out into strength — it is one adding capital as the stock fell.
Source: Q4 FY2025 Financial Statements, Note 27 Share Capital (Dec-2025 and Dec-2024 columns) [17]. Public and combined figures derived from the same table.
Key management compensation is modest against the earnings base: the Board of Directors drew Rp100.4 billion and the Board of Commissioners Rp25.5 billion in aggregate for FY2024, together under 4% of that year's net profit [18]. A management and employee stock-option programme (MESOP) exists but is small, sourced from about 1.8% of capital in treasury shares [19].
The balance sheet, and the question of survival
A tower business is a leveraged business — the towers are long-lived, the leases are contracted, and operators fund the steel with debt against those cash flows. TOWR is no exception: it carried Rp44.6 trillion of bank loans and bonds at the end of 2025 against Rp27.1 trillion of equity [20]. For an investor whose first fear is bankruptcy, the direction of travel is what counts, and in 2025 it moved the right way.
The 2025 rights issue raised Rp5.5 trillion, and management used it — plus internally generated cash — to pay down more than it borrowed. Net debt to EBITDA fell to 3.74x from 4.6x a year earlier, net debt to equity dropped to 1.6x from 2.6x, and the average cost of borrowing came down to 6.0% from 6.5% as Bank Indonesia cut rates [21]. The group holds investment-grade ratings — BBB- from S&P and an AAA national-scale rating from Fitch — and interest cover of roughly 3.9x [22].
Source: FY2025 Annual Report, Key Ratios [23].
That does not make the leverage trivial — at 3.7x, net debt is still nearly four years of EBITDA, and a landlord this indebted has little tolerance for a sustained fall in occupancy. But the combination of contracted cash flows, investment-grade access to rupiah debt, a rate tailwind, and a controlling owner willing to inject equity places the near-term risk of financial distress low rather than acute. The deleveraging leaned on Rp5.5 trillion of fresh equity, not purely on free cash flow, so the improvement is partly a one-time repair rather than proof the business self-funds its own debt reduction.
The stock, and what this report examines
The reason TOWR is worth a professional investor's time is the gap between that operating picture and the share price. The stock changes hands near Rp414, down from an intra-January high of Rp625 in 2026 and far below the levels it commanded when the market treated it as a growth compounder. At Rp414 against FY2025 earnings per share of Rp69, the shares trade at roughly six times earnings [24]; the equity is capitalised at around Rp24 trillion, and the enterprise at roughly six times EBITDA once net debt is added. Analyst consensus, for what it is worth, sits well above the price — a mean target near Rp685, some 65% higher.
Source: company share-price data feed (Yahoo Finance, TOWR.JK); first session shown (23 Jan) and month-end closes through 23 July 2026. Consensus target from analyst estimates feed (S&P Global), July 2026.
Which frames the question this report exists to answer, and that the chapters to follow test from different angles: whether TOWR's fall from a growth-stock premium to roughly six times earnings marks a permanent derating of a tower landlord hemmed in by a consolidating three-carrier market, or the mispricing of a deleveraged, cash-generative, family-controlled asset whose growth has slowed but not stopped. The bull points to margins, contracted cash flows, insider buying and a discounted multiple; the bear points to carrier mergers churning tenants off towers, a tenancy ratio that has not climbed, and leverage that still needs feeding. The evidence for each is what follows.
Financials and Estimates
Five years of statements describe a business whose revenue rose 54% — from Rp8.6 trillion in 2021 to Rp13.3 trillion in 2025 — while earnings per share held at Rp69 in both bookend years. The gap is explained inside the accounts: growth has decelerated as the core tower-lease line flattened, finance costs still absorb roughly two-fifths of operating profit, and successive equity raises spread the profit over more shares. Consensus expects low-single-digit revenue growth and easing returns through 2028.
FY2025 Revenue (Rp tn)
EBITDA Margin
Net Profit (Rp tn)
Free Cash Flow (Rp tn)
Net Debt / EBITDA
Source: FY2025 Annual Report, Financial Highlights and Key Ratios [1] [2]; free cash flow derived as operating cash flow less capex.
Revenue climbed; per-share earnings did not
Revenue growth has faded steadily since the 2021 acquisition of Indosat's tower portfolio, which drove the 27.8% jump into 2022. The three years since have run +6.4%, +8.5% and +4.6% — a business settling into mid-single-digit growth [3]. Operating profit tracked revenue, rising 39% over four years to Rp7.5 trillion. Net profit did not: it moved from Rp3.45 trillion in 2021 to Rp3.68 trillion in 2025, up 7% in total, and basic earnings per share printed Rp69, Rp69, Rp65, Rp67, Rp69 across the five years [4].
Source: FY2023 and FY2025 Annual Reports, Financial Highlights; net profit attributable to owners of the parent [5] [6].
Two effects hold the bottom line down. The first is where the growth comes from; the second is what happens between operating profit and the shareholder.
Where growth is coming from — and where it is not
The company reports revenue in three lines. Tower tenancies — the long-term, non-cancellable lease income that defines the landlord model — grew just 2.1% and 2.4% in the last two years, from Rp8.35 trillion in 2023 to Rp8.73 trillion in 2025 [7]. All the top-line growth is in the adjacent businesses: VSAT and wireline (fibre) revenue rose 28.6% then 31.4% to Rp1.55 trillion, and services and other rose to Rp3.05 trillion. The tower line, 71% of revenue in 2023, is down to 65% in 2025.
Source: FY2025 Annual Report, Operational Highlights (Revenue by Line) [8].
That mix shift is visible in margins. Group EBITDA margin held above 86% in 2021–2022 and has since drifted to 85.0%, 84.0% and 82.3% [9]. The lower-margin fibre and services lines are doing the growing, so the blended margin erodes even as absolute EBITDA rises. An 82% EBITDA margin is still high in absolute terms; the point is the direction, and its source in the revenue mix rather than in cost inflation.
From operating profit to net profit: the finance-cost wedge
The larger drag sits below operating profit. In 2025, operating profit of Rp7.50 trillion became profit for the year of Rp3.68 trillion. Net finance cost of Rp3.08 trillion — interest on roughly Rp44.6 trillion of bank loans and bonds — took 41% of operating profit, and Indonesia's final-tax regime on tower rental took a further Rp0.77 trillion [10]. Between them, roughly half of operating profit never reaches the income line.
Source: FY2025 Annual Report, Consolidated Statement of Profit or Loss and Financial Highlights [11] [12].
This wedge is the reason a landlord with 82% EBITDA margins reports a ~28% net margin, and it is also where the deleveraging matters. Finance cost was already flat year-on-year (Rp3.14 trillion in 2024, Rp3.08 trillion in 2025) even as average debt rose, and the second-half 2025 debt reduction — gross borrowings fell from Rp51.4 trillion to Rp44.6 trillion — lands mostly in future years [13]. Lower interest expense is the clearest path by which flat operating profit could still lift earnings per share.
Cash generation and the balance-sheet reset
Cash conversion is the strongest part of the record. Operating cash flow rose every year, reaching Rp10.35 trillion in 2025, while capital expenditure fell to Rp3.29 trillion from Rp4.52 trillion as tower building slowed. Free cash flow — operating cash flow less capex — stepped up to Rp7.07 trillion, from Rp4.82 trillion a year earlier [14]. Against net profit of Rp3.68 trillion, that is cash generation well ahead of accounting earnings — the depreciation on a large tower base is a non-cash charge, so reported profit understates the cash the assets throw off.
Source: audited consolidated statements of cash flows, FY2020–FY2025; capex is purchases of fixed assets, free cash flow derived [15].
That cash, plus a Rp5.5 trillion rights issue, funded a genuine reset of the balance sheet. Equity rose from Rp19.2 trillion to Rp27.1 trillion, gross debt fell Rp6.9 trillion, and net debt to EBITDA dropped to 3.7x from 4.6x — the sharpest single-year deleveraging in the five-year record [16]. The equity injection is also why reported return on equity fell — from 20.0% in 2023 to 13.6% in 2025 — despite higher profit: the denominator grew faster than the numerator [17]. The reset leaned on fresh equity, not only on internal cash; but with free cash flow now above Rp7 trillion, the business can continue reducing debt from its own generation.
Source: FY2023, FY2024 and FY2025 Annual Reports, Financial Highlights and Key Ratios; free cash flow derived from cash-flow statements [18] [19] [20].
What consensus expects
Thirteen analysts cover the stock, and their forward view is modest. Revenue is seen at Rp13.9 trillion in 2026 and Rp14.2 trillion in 2027 — roughly 4.5% then 2.3% growth — with EBITDA edging from Rp11.2 trillion toward Rp11.6 trillion [21]. Earnings per share are expected to dip to about Rp67 in 2026 — the full-year effect of the enlarged share count from the 2025 rights issue — before recovering to roughly Rp72 in 2027 and Rp73 by 2028, still barely above the Rp69 posted in 2021. Consensus return on equity eases from the mid-teens toward roughly 12.5% by 2028.
Sources: FY2024–FY2025 actuals from Financial Highlights [22]; FY2026–FY2029 consensus estimates [23].
The consensus price target is Rp685 (median Rp660; range Rp390–Rp950), about 65% above the recent Rp414, with nine of thirteen analysts at their strongest buy rating and none negative [24]. The dividend is expected to grow from roughly Rp19 per share for 2025 toward Rp21 by 2027 — a yield near 5% at the current price, and one the free-cash-flow profile can cover several times over. The tension is plain in the numbers: analysts pair low-single-digit operating growth and a declining return on equity with a target two-thirds above the market price. The bridge between the two is deleveraging and a re-rating of the multiple, not a re-acceleration of the business — a reconciliation the valuation and competition chapters take up.
What would change the read
The financials support a specific reading: this is a cash-rich, deleveraging landlord whose aggregate profit grows slowly and whose per-share earnings have been flat, not a business in decline. Three things would move that read. If tower-tenancy revenue — the durable core — resumed mid-single-digit growth rather than the ~2% of the last two years, the low-growth label would weaken. If finance costs fell materially as the lower debt balance flows through 2026–2027, flat operating profit could still produce visible EPS growth. And if capex re-accelerates toward the Rp4–5 trillion consensus pencils in for later years, the 2025 free-cash-flow step-up would prove partly a timing effect rather than a durable new level.
Carrier Consolidation
TOWR's revenue now comes 87% from three carriers, and after the 2025 XL–Smartfren merger its single largest customer, XLSmart, supplies 42% while Indosat supplies another 34% — two merged operators covering three-quarters of the top of the book [1]. The same consolidation that concentrated the base is the demand-side reason tower-leasing revenue barely grows: merged carriers deduplicate overlapping sites and keep one tenant where two once sat. Real secular tailwinds — double-digit data-traffic growth, 5G, fibre — reach TOWR through a narrowing set of buyers.
A market that keeps collapsing into fewer buyers
Indonesia's mobile market has consolidated twice in three years. Indosat Ooredoo merged with Tri (Hutchison) into PT Indosat Ooredoo Hutchison in 2022, and in 2025 XL Axiata combined with Smartfren to form PT XLSmart Telecom Sejahtera [2]. What was a field of five or six wireless operators is now effectively three national buyers of tower space — Telkomsel, Indosat, and XLSmart. Management's own framing is telling: it reports growth "despite ongoing consolidation in the telecommunications industry," a phrase that appears where a landlord would normally describe demand [3].
For an independent tower company, fewer carriers is a structural fact, not a passing one. Every tenant a tower can hold must come from three counterparties, and each of those counterparties now has more sites of its own and more bargaining power at renewal. This is the mechanism sitting underneath the near-flat tower-leasing line documented in Financials and Estimates.
The concentration, from the audited note
The revenue-concentration disclosure in the financial statements makes the shift precise. In 2023 the top three customers were Indosat (38%), XL Axiata (31%), and Telkomsel (12%) — 81% combined. In 2024 they were 79%. In 2025, with XL and Smartfren folded into one line, the top three reached 87% [4] [5].
Largest customer (XLSmart)
Top two customers
Top three customers
Source: FY2025 Annual Report, revenue-concentration note [6].
Source: FY2024 and FY2025 Annual Reports, revenue-concentration notes [7] [8].
Two things stand out. First, the single largest customer share rose from 35% (Indosat in 2024) to 42% (XLSmart in 2025), because the merger fused what had been two separate tenants — XL at 32% and Smartfren-related billings — into one relationship [9]. Part of the 79%-to-87% step is therefore mechanical relabelling rather than fresh dependence — a former "other" customer now sits inside a named top-three line. But the economic point is unchanged: the number of independent decision-makers who set TOWR's tower demand fell from four to three, and two of them now write three-quarters of the cheque.
Source: FY2025 Annual Report, revenue-concentration note; total revenue Rp13.33tn [10] [11].
Concentration this high is not unique to TOWR — it is the shape of the industry. Peer Mitratel reports that 89% of its revenue comes from Indonesia's largest mobile operators, anchored on Telkomsel [12]. A tower landlord's customers are, by definition, the handful of carriers licensed to run a national network. Concentration is inherent to the model; what matters here is that it is rising and that the counterparties are sound.
One fact cuts the other way on soundness. As the base concentrated, credit exposure actually improved: gross third-party trade receivables fell to Rp2.0 trillion at end-2025 from Rp3.37 trillion a year earlier, and the allowance for expected credit losses dropped to Rp35.3 billion from Rp93.2 billion [13]. The three counterparties are large, investment-grade-adjacent carriers that pay; concentration here is concentration among strong names, not weak ones.
Why consolidation holds the tower line flat
The demand-side damage from a carrier merger is specific and well understood in this industry. Smaller peer Gihon described it plainly a year ahead of the event: after a merger the two operators "consolidate their tower leases, potentially retaining only one tenant per site that was previously occupied by two entities," mirroring what followed the Indosat–Hutchison combination, "which caused a decline in tenancy ratio" at tower providers [14]. A year later Gihon confirmed it had happened: the completed XL–Smartfren merger "led to network adjustments by the operators, which temporarily affected the demand for tower leasing in the second half of the year" [15].
TOWR's own tenancy and fibre-utilisation figures show the same merger drag, and are examined in Colocation Engine.
The tailwinds are real — and they run through a narrower funnel
None of this means demand for connectivity is weak. The secular pull behind the business is genuine and worth stating on its own terms.
Data traffic has grown at a double-digit CAGR for years and management expects that to continue, driven by heavier mobile and fixed internet use, the early adoption of cloud and AI, and the eventual rollout of 5G once spectrum is released [16]. Indonesia's internet penetration has reached roughly 80% with rising ARPU as usage deepens [17], and the decade-long shift from wired to wireless communication continues to feed demand for tower and fibre infrastructure [18]. Management's 2026 outlook rests on the same pillars: sustained demand for high-speed internet, continued 4G build-out, potential 5G, cloud and AI adoption, and — importantly for a landlord — carriers' shift toward "asset-light" strategies that push infrastructure ownership onto tower companies [19].
The tension is that these two forces point in opposite directions at the tower line. Rising data traffic pulls demand for capacity up; carrier consolidation pushes the number of tenants per site — and the number of buyers who can pay for that capacity — down. The visible outcome so far is that data-driven demand shows up mostly in the non-tower businesses (fibre, connectivity, FTTH), while the tower-tenancy line stays close to flat because the buyer count keeps shrinking. The asset-light tailwind is real, but it is a tailwind delivered by three counterparties with growing leverage over price.
The read, and what would change it
On balance, carrier consolidation is a durable structural headwind to tower-tenancy growth and a genuine rise in customer concentration — the demand-side reason forward growth is modelled at only low-single digits. It is the strongest fact on the permanent-derating side of the report's central question.
The counter-case is not trivial. Lease contracts run 10–13 years and are non-cancellable, so churn from deduplication is a slow grind of non-renewals and relocations, not a cliff — the towers already built keep paying while the merged carriers work through their overlaps. The counterparties are financially strong and their receivables are shrinking, not stretching. And each merged carrier still has to densify its network to carry double-digit traffic growth, which over time argues for more equipment on towers, not less. What would move the read toward the mispricing side: evidence that a merged carrier's net site count has stopped falling and turned up, or a return to a fourth national buyer. What would harden the bear read: a step-down in tenancy or tower-leasing revenue as XLSmart works through its site overlap the way Indosat–Hutchison still is.
Colocation Engine
A telecom tower is a fixed-cost asset that gets dramatically better with a second tenant. On the company's own simulation, adding a second lessee to an existing tower roughly doubles revenue at almost no extra cost, lifting unlevered return on investment from about 11% to about 21% and halving the payback period. That operating leverage — not the concrete and steel — is TOWR's moat. The problem this chapter documents: that lever is barely being pulled. Tenancy has sat near 1.67x, sector-wide ratios are falling as three carriers deduplicate overlapping sites, and 2025 tower-leasing gross profit grew just 0.81%.
What a second tenant does
The tower business's returns are most sensitive to one number: the tenancy ratio, or tenants per tower. Building a tower and signing its first ("anchor") tenant is a mediocre standalone investment. Loading a second tenant onto that same structure is one of the best returns in infrastructure, because — in the company's words — "the operating costs of the towers are largely fixed, and the Company incurs only relatively low costs to add tenants." [1]
TOWR's public simulation for a single tower makes the leverage explicit.
Source: TOWR public expose, "Colocation Boosts ROI" single-tower simulation (ROI defined as EBITDA less 10% final tax over total capex; 10-year ground lease) [2].
Unlevered ROI — second tenant
Payback — second tenant (yrs)
The second tenant pays Rp144 million more in annual rent against roughly Rp150 million of extra capex; the incremental EBITDA margin is close to 100%, which is why the blended margin rises from 85.0% to 88.5% and the unlevered ROI nearly doubles. [3] This is the entire reason independent towercos exist: a landlord can earn a return on a shared mast that no single carrier building alone ever could.
Two features protect that stream once it exists. Leases run "10 years for tower and can be longer for fiber," are non-cancellable and renewable; renewal is near-automatic because relocating equipment is costly and disruptive to a carrier's network. [4] The barriers to a new entrant — capital, scale, permitting, local relationships — are high. [5] The asset quality the value case rests on is real, and it is this: contracted, escalating, high-switching-cost cash flows with a dormant high-return upgrade path built in.
The engine is idling
The upgrade path is what has stalled. TOWR ended 2025 with 36,247 towers and 60,540 tenants — a tenancy ratio of 1.67x, against 35,400 towers and 58,035 tenants (about 1.64x) a year earlier. [6] A rising ratio would be the collocation engine at work. This one barely moved, and management was candid that even the small uptick was not new demand: the ratio is "1.67, slightly higher than 2024, because we basically restructured some reseller contracts to become direct lease to our towers… in the past, we did not count reseller as part of tenancy ratios." [7] Strip out the reclassification and organic tenancy was flat.
This is not a TOWR execution problem — it is the market structure the report has been circling. Across Indonesia's listed towercos, tenancy ratios are declining as the carrier count falls. Tower Bersama, the operator that has historically run the sector's highest ratio, has seen it slide every year: 1.87x in 2022, 1.84x in 2023, 1.79x in 2024, and 1.73x in 2025. [8] [9]
Sources: Tower Bersama operational tables (FY2024, FY2025 Annual Reports) [10] [11]; TOWR ratios derived from year-end tower and tenant counts [12]. TOWR's 2025 figure includes reclassified reseller contracts.
The peer that sits closest to TOWR draws the ceiling plainly. Gihon reports its own ratio at 1.67x, notes the 2025 Indonesian industry average ran "1.60x–1.75x," and describes even 1.80x as a "near-term target" it has not reached. [13] The pattern is not local to Indonesia: in India, another market consolidated to roughly three national carriers, Indus Towers runs a tenancy ratio of about 1.65x, while portfolio towers in the fragmented United States market carry 2.4–2.6 tenants apiece. Tenancy ratio is, to a first approximation, a function of how many independent buyers exist — and Indonesia now has three. That is the structural fact the derating side of the thesis leans on: with the buyer base fixed, the collocation lever cannot be pulled at will.
Where the growth went instead
If the highest-return lever is stuck, growth has to come from somewhere lower down the return ladder — and the segment accounts show exactly where. TOWR now reports two segments: tower leasing and everything non-tower (fibre-to-the-tower, FTTH, connectivity). In 2025 the tower-leasing segment's gross profit grew just 0.81% year-to-date, while the non-tower segment's grew 14.05%. [14] Tower leasing brought in Rp8.73 trillion of revenue and non-tower Rp4.60 trillion. [15]
Sources: segment revenue split (FY2025 Annual Report, Directors' Report [16]); segment operating profit and growth (Business Segment Operational Review [17]). Operating margins computed on segment revenue.
The tower line still earns a 62% operating margin against 44% for non-tower [18] — so as the mix tilts toward fibre, blended profitability dilutes, which is the mechanical source of the margin drift earlier chapters traced. And the tower line itself is decelerating: leasing revenue grew 5.0% in 2024, to Rp8.53 trillion [19], then roughly 2.3% in 2025 to Rp8.73 trillion. [20]
Even within towers, the growth that does occur is the low-return kind. TOWR's model is anchor-first: it builds "build-to-suit" towers only once an operator commits as anchor tenant, then hunts for collocation later. [21] Of the 847 towers added in 2025, management noted most were relocations tied to the Indosat-Hutchison integration rather than fresh multi-tenant demand — "short of a couple of hundred towers that we need to conclude for Indosat, Hutchison." [22] A single-tenant new tower earns roughly the 11% ROI in the simulation above, not the 21%. The company is adding towers and fibre — deploying capital at the low-return end of its own opportunity set — precisely because the 21% collocation return is not on offer in a three-carrier market.
What it means
This tenancy stall is the operational fact beneath the stock's derating. The best thing about a tower business — the near-free second tenant — is exactly the thing TOWR cannot currently do much of, and that is a defensible reason the market has stopped paying a growth multiple for it. The case is most sensitive to the tenancy ratio: if it keeps grinding down toward the low-1.6s, the derating is right; if it turns up, the mispricing is.
The counter is that the lever is dormant, not broken. Every tower already standing carries embedded, near-100%-margin capacity that costs almost nothing to fill, and the demand that would fill it — surging data traffic, eventual 5G densification, and the resolution of merger-driven site overlap once carriers finish rationalising — is a question of when, not whether new towers get built. A move from 1.67x back toward the 1.80x that peers still frame as reachable [23] would drop through to profit at incremental margins the fibre business cannot match, and the market is currently paying nothing for that optionality. The honest position is that both readings are live, and the tenancy ratio — reported every quarter — is where a patient investor gets to watch which one is winning.
Valuation Gap
At about Rp414, TOWR trades at roughly six times FY2025 earnings and about 6.2 times EV/EBITDA — some 40% below its own five-year average multiple and close to half what its two listed Indonesian tower peers command. On the reported numbers that reads like a landlord priced for distress, and a headline free-cash-flow yield in the low teens seems to confirm it. But that low-teens yield rests on a cash-flow figure that flatters the picture. The Rp7.07 trillion of "free cash flow" TOWR reports is struck before it pays its lenders; after Rp2.78 trillion of cash interest and Rp1.26 trillion of lease payments, roughly Rp3.0 trillion actually reaches equity — set against Rp15.5 trillion of debt maturing within a year and Rp2.27 trillion of cash on hand. [1]
The Rp7.07 trillion is not cash available to shareholders; it is what the towers generate before the lenders are paid. What actually reaches equity is roughly Rp3.0 trillion — about 0.82 times reported net profit, and the figure the dividend and the maturity wall have to be judged against, not the headline. That equity cash flow covers the Rp1.19 trillion dividend about 2.5 times over. It does not cover the debt: the Rp2.27 trillion of cash on hand is about 0.15 times the Rp15.5 trillion maturing inside a year, so the margin of safety here is refinancing access rather than a self-funding balance sheet. The same facts read the other way in normal conditions. The debt is investment-grade (S&P BBB-, Fitch AAA(idn)); a large share of the sub-one-year figure is auto-renewing revolvers; and management says it "paid down IDR 1.5 trillion more than from our own operations," so in an ordinary market the rollover is routine. The correction lowers the cash-flow yield; it does not, on its own, break the thesis. This chapter takes the multiple apart and asks how much pessimism it already holds.
What the headline cash-flow yield hides
The mechanics sit in the cash-flow statement. Because interest and lease payments are booked as financing rather than operating, the Rp10.35 trillion of operating cash flow, and the Rp7.07 trillion of "free cash flow" left after Rp3.29 trillion of capex, are both struck before the company pays its lenders [2]. For a business with Rp44 trillion of debt, that is not a rounding issue.
Reading down the financing section, cash interest paid was Rp2.69 trillion on loans plus Rp0.09 trillion on bonds, and lease liabilities absorbed a further Rp1.26 trillion [3]. Net those against the reported figure and free cash flow available to equity is about Rp3.0 trillion — closer to reported net profit than to the Rp7.07 trillion headline, and less than half of it.
Source: FY2025 Annual Report, Consolidated Statement of Cash Flows — operating cash flow, capex, interest, leases and dividends [4]; bridge derived by the author.
The corrected number changes the valuation only partly, and in the bull's favour more than the bear's. An equity free-cash-flow yield of about 12% on the Rp24.5 trillion market capitalisation is lower than the ~29% a naïve OCF-less-capex reading implies, but it is still a high yield for a contracted-revenue landlord — and it is real cash, after the lenders are paid. The honest framing is that TOWR's cash generation supports the low multiple rather than pointing to mispricing on its own: a low-teens yield is what a market demands from an asset it expects to grow slowly and views as carrying customer-concentration risk.
The multiple today
Four numbers frame the valuation. On FY2025 reported basic earnings per share of Rp69 [5], the Rp414 price is 6.0 times earnings. Enterprise value — a market capitalisation of about Rp24.5 trillion on ~59.1 billion shares, plus net debt of Rp43.9 trillion (Rp44.55 trillion of bank loans and bonds less Rp0.65 trillion of cash) [6] — is about Rp68.4 trillion, or 6.2 times the ~Rp11.0 trillion of EBITDA implied by the 82.3% margin on Rp13.33 trillion of revenue [7].
P/E (FY2025)
EV / EBITDA
Equity FCF Yield
Dividend Yield
Sources: price Rp414 (23 Jul 2026) and share count per the trading feed; earnings and balance-sheet figures from the FY2025 Annual Report [8] [9] [10]; equity FCF and dividend yield derived below.
The headline 6.0 times earnings flatters slightly. Reported EPS of Rp69 divides FY2025 net profit of Rp3.68 trillion [11] by a weighted-average share count of about 53.3 billion, but the 2025 rights issue lifted shares outstanding to 59.1 billion by year-end. Valued on the full post-issue share base, the same Rp3.68 trillion of profit is 6.65 times the Rp24.5 trillion market capitalisation. Either way the number sits in single digits — the point of departure for the rest of this chapter.
A derating from the company's own history
TOWR is not cheap only in the abstract; it is cheap against what the market paid for the identical asset three years ago. Third-party trackers put its EV/EBITDA at roughly 12.5 times at the end of 2022, a five-year average near 10–11 times, and a recent reading of about 6.7–8.2 times depending on the EBITDA and lease definitions used. The internally consistent figure from the audited accounts — Rp68.4 trillion of enterprise value over Rp11.0 trillion of EBITDA — is about 6.2 times. On any of these measures the multiple has compressed by 35–50% from its peak, and the compression tracks the story the earlier chapters documented: growth decelerating to mid-single digits, carrier consolidation narrowing the buyer base, and per-share earnings going nowhere.
Sources: TOWR audited figures (FY2025 Annual Report [12]); TOWR five-year average and peer multiples (Tower Bersama ~15x, Mitratel ~18x on FY2026 estimates) per third-party market data — peer bases may not be strictly like-for-like on lease treatment.
The peer gap is the sharper of the two comparisons. Tower Bersama (TBIG) trades around 15 times forward EV/EBITDA and Mitratel (MTEL) around 18 times on 2026 estimates — roughly two to three times TOWR's multiple — even though TOWR is the largest of the three by tower count (36,247 towers) and generates the strongest free cash flow. Some of that gap is defensible: TOWR carries more net debt relative to EBITDA than either peer and its single largest customer is 42% of revenue. But a discount of roughly half, against a company whose leverage is falling and whose cash generation is higher, is a wide gap to close with fundamentals alone.
The dividend, and how well it is covered
TOWR pays a modest, rising dividend rather than distributing the bulk of its cash. Dividends to owners of the parent were Rp1.19 trillion in 2025 [13], against a policy that sets payout by resolution of the annual meeting after weighing financial condition and investment plans [14]. That is roughly Rp20 per share, a yield near 4.9% at Rp414, and consensus expects a similar Rp19–21 per share over the next few years.
The coverage matters more than the level. At about Rp3.0 trillion of equity free cash flow, the Rp1.19 trillion dividend is covered roughly 2.5 times — leaving the balance to keep reducing debt. The remaining question the earlier financials chapter flagged is durability: consensus rebuilds capex toward Rp4.2–5.4 trillion from the Rp3.29 trillion low, which would trim equity free cash flow and thin that coverage, though not below the dividend.
What the price implies, and what the target assumes
At a low-teens equity FCF yield and a ~4.9% dividend yield with payout near a third of earnings, the price embeds little per-share growth and a high required return — consistent with a market that has taken the concentration and consolidation warnings to heart. The clearest way to see the asymmetry is against the sell-side. Consensus, drawn from 13 analysts, carries a mean target of about Rp685 — some 65% above the current price — with a Rp660 median, a Rp390 low and a Rp950 high, and forward EPS of about Rp67 for 2026 and Rp72 for 2027.
Sources: consensus targets and FY2026 EPS estimate of Rp67.24 per the analyst estimate feed (13 analysts, S&P Global); implied P/E derived by the author (price ÷ Rp67.24).
What the Rp685 mean target assumes is not heroic: about 10 times forward earnings, roughly TOWR's own historical average multiple and still below its listed peers. In other words, consensus is pricing a re-rating back toward normal, not a re-acceleration of the business — the bet is that the derating overshot. Two mechanical levers support that view without any growth at all. Deleveraging shifts enterprise value from debt-holders to equity: as net debt falls, the same EV/EBITDA multiple lands more of the value on the shares, and consensus forward EV/EBITDA compresses toward 4–5 times as EBITDA rises and net debt shrinks. And falling finance costs — net finance cost took 41% of operating profit in FY2025 — flow to the bottom line as the Rp44 trillion debt load reprices and amortises, the lever the Financials and Estimates chapter identified.
The two-sided read
The evidence points to a stock that is genuinely cheap relative to its own history and its peers, but not cheap without reason. The strongest fact for a rational-derating read is that the discount lines up with deteriorated fundamentals the report has already established: earnings per share flat at Rp69 for five years, top-three customer concentration at 87%, ROE down to 13.6% on the enlarged equity base [15], and forward revenue growth of only 2–4%. A landlord that cannot grow per-share earnings and depends on three buyers should not trade like a compounder.
The strongest fact against it is that the compression looks larger than those fundamentals justify. Half the peer multiple and 40% below its own average is a steep price for a business that still earns an 82% EBITDA margin, generates ~Rp3 trillion of genuine equity free cash flow after paying its lenders, covers its dividend 2.5 times, and is actively cutting leverage — with the controlling family having added Rp5.5 trillion of its own capital as the stock fell. Two things would decide it, and both are checkable: whether the tower-tenancy revenue line stabilises as XLSmart works through its site overlap, and whether the falling finance cost finally lets EPS break above the Rp69 ceiling it has held since 2021. If both turn, the consensus re-rating to ~10 times requires no acceleration in growth; if the tower line steps down instead, today's multiple is the fair one.
Control and Capital
TOWR is controlled by Indonesia's Hartono family — the owners of Djarum and Bank Central Asia — through two vehicles that together hold about 65% of the shares [1]. The defining capital-allocation event of the period was a rights issue the family funded almost by itself, while the same family bank sits among TOWR's lenders. The Hartono family funded roughly 98% of TOWR's Rp5.5 trillion rights issue at Rp680 a share — above today's Rp414 — while, through its own bank BCA, sitting on the other side of about 9% of the company's debt: the controller is at once its largest owner and a meaningful lender to it. [2] [3].
The alignment is in the size of the cheque. Roughly Rp5.4 trillion of fresh family cash lifted the combined stake from 60.0% to 65.2% [4], diluting minorities below 35%, at a Rp680 subscription price that now sits below the Rp414 market — capital put in on conviction, not taken out. The other side of the ledger sits in the same view: the raise was a regulated rights offering in which the family committed as standby buyer [5] rather than a discretionary purchase, and the BCA loan is a captive but stable credit line that has shrunk year-on-year — benign in normal conditions, a related party on both sides of the table under stress. Director pay is controller-set as well; the alignment is real, but it is not a clean bill of governance.
This chapter audits the "strong-promoter" side of the thesis: who controls TOWR, what they have done with capital, and the related-party arrangements a skeptic should price in.
Who controls the company
The register lists two controlling vehicles. As of the end of 2025, PT Sapta Adhikari Investama held 45.29% and PT Dwimuria Investama Andalan held 19.95% — a combined 65.24% [6]. Both trace to the Hartono family: the audited related-party note groups PT Bank Central Asia, PT Djarum, PT Grand Indonesia and Blibli's parent PT Global Digital Niaga under "family relationship with the ultimate shareholders" [7], and the list extends to Polytron's PT Hartono Istana Teknologi and other family holdings [8]. This is a founder-controlled asset inside one of Indonesia's largest private groups, not a professionally-diffused public company.
The two vehicles are not static. Before the July 2025 rights issue, Sapta held 54.42% and Dwimuria only 5.59% — a combined 60.01% [9]. The rights issue reshuffled the holding: Sapta's stake fell as it left rights unexercised, while Dwimuria — the standby buyer — more than tripled its position. The family's combined stake rose by roughly five points even as the split between its two vehicles inverted.
Sources: end-2025 register per the Q1 FY2026 financial statements [10]; pre-issue register per the Q3 FY2025 financial statements [11].
The rights issue was a family-funded deleveraging
The single most important capital-allocation event of the period was the July 2025 rights issue. TOWR offered 8,083,478,731 new shares — 13.91% of the enlarged capital — at Rp680 each, raising about Rp5.50 trillion, with Dwimuria (then holding 8.33%) committing to take up its full entitlement and to act as standby buyer for any shares other holders left behind [12]. Every rupiah went into subsidiary Protelindo, which used it "to repay all and/or part of its principal debt" [13]. This is the raise that took net debt/EBITDA from about 4.6 times to 3.74 [14].
The mechanics matter for alignment. The family's combined holding grew from roughly 30.6 billion shares (60.01% of 51.0 billion) to about 38.6 billion (65.24% of 59.1 billion) — an increase of close to 7.9 billion shares. At Rp680, that is on the order of Rp5.4 trillion of fresh cash from the family, roughly 98% of the entire raise. Minority holders who did not follow their rights were diluted from about 40% of the company to under 35%; those who subscribed pro-rata were not. Either way, the deleveraging that reset the balance sheet was paid for almost entirely by the controlling family — and at Rp680, well above today's Rp414.
Capital allocation: balance sheet first
The rights issue is one move in a consistent pattern: through 2025 management prioritised the balance sheet over near-term shareholder payout, while continuing to make small, adjacent acquisitions.
The dividend was cut, not defended. Cash dividends fell from Rp24.1 per share for FY2023 to about Rp800 billion (near Rp15.9 per share) for FY2024 [15], and the only FY2025 distribution declared so far is an interim of Rp6.87 per share resolved in December 2025 [16]. For an investor who fears bankruptcy above all, a controller that trims the dividend and injects equity to cut leverage — rather than sustaining a payout on borrowed money — is behaving the right way round.
Sources: FY2023 and FY2024 dividends per the FY2025 Annual Report dividend note [17]; FY2025 interim per the corporate site disclosures [18]. FY2025 is an interim figure only; a final dividend for FY2025 had not been declared at the report date.
M&A stayed small and on-strategy. In April 2025 subsidiary iForte bought 40% of listed fibre operator PT Remala Abadi (DATA) at Rp974 per share, triggering a mandatory tender offer and a call option toward 51% [19]; in September it completed a 51% purchase of connectivity provider PT Media Antar Nusa (MAN) [20]. Both extend the fibre-and-connectivity build that the earlier chapters identified as the group's real growth engine, and both are modest relative to a company carrying tens of trillions of rupiah in assets.
The buyback was opportunistic and small. Between 4 September and 3 December 2025, with the shares falling, TOWR repurchased about 122.4 million shares using internal funds, explicitly to support price stability [21] — roughly 0.2% of the share count, a signal rather than a return-of-capital programme. The sequencing is telling: raise Rp5.5 trillion of equity to cut debt, then buy back a token amount of stock at a lower price. It reads as balance-sheet discipline first, with the buyback as a modest vote of confidence rather than the main event.
What a skeptic checks: the related-party web
Family control cuts both ways, and the reasonable worry is self-dealing through the group. The audited accounts let us size it. Transactions with related parties are stated to be "based on terms and conditions agreed among the parties" [22], and in the profit-and-loss they are small: related-party revenue was 1% of total revenue and related-party cost of revenue about 5% in FY2025 [23]. Key management compensation was Rp114.3 billion, about 3% of net profit and lower than the prior year [24].
Related-party revenue / total revenue
Related-party COGS / total COGS
BCA loan / total debt
Key-mgmt pay / net profit
Sources: related-party revenue and cost percentages and key-management compensation, FY2025 Annual Report [25] [26]; BCA loan and total debt per the related-party balances and financial highlights [27] [28].
Two arrangements deserve to be named rather than buried. First, the largest single related-party item is a bank loan of Rp4.00 trillion from PT Bank Central Asia — the family's own bank — down from Rp4.83 trillion a year earlier [29]. That is roughly 9% of TOWR's Rp44.6 trillion of bank loans and bonds [30]: the controller both owns the company and is a meaningful lender to it. In benign conditions that is a stable, captive source of credit; in a stress scenario it is a related party sitting on both sides of the table. Second, the remuneration of the Board of Directors is determined by PT Sapta Adhikari as controlling shareholder, which holds "the authority and power to determine the amount" [31]. Pay-setting sits with the controller rather than an independent committee — a governance concentration that the modest, declining compensation figure mitigates but does not remove.
The read
On the evidence, the alignment leg of the thesis holds up. The Hartono family controls 65% of TOWR, and when the balance sheet needed repair it wrote almost the entire cheque itself — at a price now a third above the market — rather than diluting minorities to strangers or leaning harder on debt. Capital allocation over the period was conservative in the way this reader wants: equity in to cut leverage, dividend trimmed to match, acquisitions kept small and adjacent, buyback token. The related-party dealings that come with a controlling family are real but, in the numbers, immaterial to the income statement — the exceptions being a Rp4 trillion loan from the family bank and controller-set director pay, both worth watching, neither large enough today to override the picture.
What would change this read: related-party balances or cost lines climbing from the current low-single-digit percentages; the BCA loan growing rather than shrinking as a share of debt; a return to a dividend funded by leverage rather than cash flow; or acquisitions that stop being small and adjacent. None of those is visible in the current filings. For an investor drawn to strong-promoter companies the market has left for dead, the record here is a controller adding capital above the market and taking little out — evidence on the alignment side of the question this report is built around.
Debt Durability
A value investor who fears bankruptcy above all wants to know whether this balance sheet can cause a permanent loss. TOWR carries roughly Rp44.6 trillion of debt at 3.74x net debt to EBITDA — investment-grade rated, largely rupiah-funded, and covered 3.9x by EBITDA — so outright default is a remote risk. But the maturity ladder is front-loaded: about Rp15.5 trillion falls due within a year against only ~Rp2.3 trillion of cash, so the margin of safety rests on continued lender access.
A stack built for rollover, not repayment
At the end of 2025 the group owed about Rp43.4 trillion to banks and Rp1.2 trillion to bondholders [1]. The public-bond program has been wound down to a residual Rp1.05 trillion by March 2026 [2]; funding now runs almost entirely through bilateral bank loans spread across more than ten lenders — BNI, Citibank, CTBC, Bank Syariah Indonesia, BNP Paribas, OCBC, KEB Hana, China Construction Bank and DBS among them [3].
Two features of that stack matter. First, almost none of it is secured on the towers: facilities are backed by a corporate guarantee or nothing at all [4], and Fitch rates the senior debt AAA(idn) unsecured [5]. Unsecured lending is the sector norm — peer Tower Bersama funds the same way [6] — and it reflects lenders' confidence in the contracted, non-cancellable tower rents behind the debt. Second, the credit is investment-grade across every scale: S&P affirmed BBB- in April 2025 and Fitch affirmed BBB internationally and AAA(idn) nationally in September 2025, all with a Stable outlook [7].
Gross debt (Rp tn)
Net debt / EBITDA
EBITDA / interest
Avg. borrowing cost
Sources: gross debt and leverage per Q4 FY2025 statements [8]; leverage 3.74x, interest coverage 3.9x and 6.0% cost per management, Q4 FY2025 earnings call [9].
The maturity wall
The undiscounted maturity schedule is the crux. Of the ~Rp44.6 trillion of debt principal, roughly Rp15.5 trillion — about 35% — comes due inside twelve months, and close to 69% falls within two years [10]. Against that near-term wall sits only Rp2.27 trillion of cash [11]. The Rp7.07 trillion of "free cash flow" TOWR reports is struck before it pays its lenders; after Rp2.78 trillion of cash interest and Rp1.26 trillion of lease payments, roughly Rp3.0 trillion actually reaches equity — set against Rp15.5 trillion of debt maturing within a year and Rp2.27 trillion of cash on hand. That equity figure, developed in the Valuation Gap chapter, is what the ladder must be judged against; the company cannot repay it from its own cash generation and must refinance it.
Source: contractual undiscounted maturities as of 31 December 2025, Q4 FY2025 financial statements [12].
That reliance is less alarming than it first looks, for three reasons. A large share of the sub-one-year figure is revolving facilities that renew automatically rather than genuine hard maturities [13]. The group also holds committed, fully-undrawn revolvers as a liquidity backstop — a Rp1.0 trillion line at BNI, Rp0.65 trillion at Citibank and Rp0.5 trillion at BNP Paribas among them [14]. And it has cleared its bank covenants — a debt-service-coverage test and a net-debt-to-running-EBITDA test — at every quarterly measurement [15]. For an investment-grade name with a decade of relationship-bank access, rolling this ladder is routine in normal markets. But "in normal markets" is the load-bearing clause: the balance sheet relies on continuous refinancing access, and that access can tighten when credit markets seize.
What could break it, and what does not
The failure modes that sink emerging-market infrastructure borrowers are currency mismatch and a rate shock. Neither is acute here.
Currency is largely defused. The debt is nominally multi-currency — rupiah, US dollar, yen and yuan tranches all appear [16] — but management borrowed "mostly rupiah during 2025" and swaps its dollar loans back into rupiah [17], leaving only a thin residual exposure. A 1% move in the rupiah against the dollar shifts pre-tax profit by just Rp56 billion, and against the yen by Rp19 billion [18]. Even a 10% rupiah depreciation would cost around Rp0.8 trillion pre-tax — roughly a fifth of net profit, uncomfortable but nowhere near solvency-threatening, and this is the exposure after hedging.
Rates are, for now, a tailwind. About 56% of the debt floats and 44% is fixed [19]. As Bank Indonesia cut, the average borrowing cost fell from 6.5% at the start of 2025 to 6.0% by year-end [20], and 2026 rupiah facilities price at 4.65%–6.95% against 4.50%–9.00% a year earlier [21]. The floating mix means falling policy rates feed through quickly to the Rp2.72 trillion annual bank-interest bill [22] — but it cuts both ways, and a reversal in Indonesian rates would land on cash interest just as fast.
Two caveats temper the comfort. The deleveraging is neither monotonic nor internally funded: bank debt fell from Rp49.9 trillion in January 2025 to Rp43.4 trillion a year later on the back of the rights issue, then crept back to Rp44.7 trillion in the first quarter of 2026 as acquisitions drew fresh borrowing [23]. Management is candid that the balance-sheet reset came from Rp5.5 trillion of shareholder equity, not operations — it "paid down IDR 1.5 trillion more than from our own operations" [24]. And disclosure is lighter than the peer set: TOWR reports only that its covenants are met, where Tower Bersama publishes its actual thresholds — a maximum debt-to-equity of 2.00x and a minimum debt-service-coverage ratio [25]. A reader cannot see how much covenant headroom actually exists.
The read
On the specific question a bankruptcy-scarred investor asks, the evidence is reassuring. Investment-grade ratings affirmed in 2025, EBITDA margins above 80%, non-cancellable contracts from a consolidating but investment-grade carrier base, hedged currency, a diversified unsecured lender group and covenants met every quarter together make an outright default a remote outcome. This is not a company at risk of going to zero on its balance sheet.
The honest qualification is that the margin of safety is supplied by refinancing access, not by a self-funding balance sheet. With ~Rp44.6 trillion of debt against a market value near Rp24 trillion, the equity is a levered claim — roughly a third of an enterprise value near Rp67 trillion — so the same leverage that amplifies the deleveraging and rate-cut upside also amplifies the downside. The read would change if the credit slipped below investment grade, a covenant were breached, Indonesian credit markets seized, or leverage drifted back toward the 4.4x it carried through 2023–24 on debt-funded acquisitions. None of those is visible today; all of them are worth watching.
Acquisition Playbook
TOWR's growth engine is the serial acquisition of listed Indonesian infrastructure companies — STP (2021), IBST (2024) and Remala (2025) — each taken over by winning a competitive tender and then running an OJK-mandated tender offer to the remaining minorities. The record shows a rules-bound acquirer whose pricing improved as the sector derated, and whose treatment of acquired-company minorities sits at the regulatory floor: no forced squeeze, no premium sweetener. Its residue is roughly Rp15.8 trillion of goodwill.
A serial acquirer of listed companies
Protelindo's largest single transaction was not organic build. In October 2021 it completed the purchase of 94.03% of PT Solusi Tunas Pratama Tbk (STP) — then Indonesia's third-largest independent tower company, with roughly 6,903 tower sites and 12,842 tenants — after a four-month competitive tender in which it was named preferred bidder, signing the sale-and-purchase agreement on 4 September 2021 [1]. Management describes it as "Protelindo's 6th acquisition and the transaction with the largest value in the last seven years" [2]. STP alone roughly doubled the tower fleet and is the reason revenue jumped in the year it consolidated — the acquisition, not the market, was the growth.
The template has repeated. In July 2024 iForte acquired 90.11% of PT Inti Bangun Sejahtera Tbk (IBST) — shares previously held by PT Bakti Taruna Sejati and other minorities [3] — at Rp2,813 per share, a total of Rp3.42 trillion [4]. In April 2025 it took 40% of PT Remala Abadi Tbk (DATA), a data-connectivity operator, again as the new controlling shareholder [5]. Each deal followed the same two-step: win control through a negotiated/tender purchase, then extend a mandatory tender offer to everyone left on the register.
Sources: STP [6] and [7]; IBST [8]; Remala [9]. Remala final ownership reached via a call option, not the MTO.
The mandatory tender offer, and what minorities did with it
Under OJK Regulation No. 9/POJK.04/2018, a new controller of a listed company must make a mandatory tender offer (MTO) to the remaining public shareholders at a regulated price [10]. It is a floor bid minorities may take or decline, not a squeeze-out — and the three deals show both outcomes.
At STP, the MTO covered up to 5.97% of the capital; Protelindo bought 67,478,878 shares and reached 99.96% [11]. At IBST, the MTO covered up to 9.89%; iForte bought 1,350,586,095 shares and reached 99.98% [12]. In both, minorities largely accepted the offer. Remala went the other way: the MTO at Rp974 per share ran to 11 August 2025 and drew a total of 900 shares — the public simply held on. To reach a 51% stake, iForte instead exercised a pre-agreed call option on 30 October 2025 to buy 151,249,100 shares from the selling shareholder [13]. The controller did not raise the price to coax minorities in; it moved to a private option and left the float in place.
Delisting is not automatic. STP, four years after the takeover, remains listed with a public float: Protelindo held 97.33% at end-2025, the public 2.67% [14]. The pattern that emerges is procedural discipline — the OJK price, the regulated process, no forced buyout below it — rather than either generosity or abuse. That is a useful read on a controller for an investor who buys behind one (Control and Capital).
What sits on the balance sheet
Serial acquisition leaves an accounting residue, and TOWR's is large. Goodwill stood at Rp15.78 trillion at end-2025, of which the 2021 STP purchase accounts for Rp15.06 trillion — the single deal is 95% of the group's goodwill and, on its own, is equal to more than half of total book equity of Rp27.08 trillion [15] [16].
Group goodwill (Rp tn)
STP goodwill (Rp tn)
Goodwill / book equity
Source: FY2025 Annual Report, Note 10 Goodwill [17]; book equity from the FY2025 statement of financial position [18].
The pricing discipline is visible in the goodwill itself. STP, bought in 2021 at the top of the tower-valuation cycle, generated Rp15.06 trillion of goodwill — a large premium over identified net assets. IBST, bought in 2024 after the sector had derated, generated only Rp305 billion, later adjusted down to Rp217 billion [19]. The later deals were struck much closer to asset value; the expensive one is the legacy of the cycle's peak.
That legacy is also the chapter's accounting-quality question. The STP goodwill has never been written down — management's annual impairment test, run at a 9.44%–9.99% discount rate, found no impairment in 2023, 2024 or 2025 [20]. The auditor treats it as a key audit matter each year, which is the right flag: the same window in which TOWR's own public multiple roughly halved, from about 12.5x earnings to about 6x (Valuation Gap), produced no impairment on a 2021-vintage tower acquisition. A value-in-use test that clears where public comparables have fallen by half is a soft check, not a hard one. It is a carrying value to watch rather than evidence of a write-down to come: goodwill is 58% of book equity, 95% of it from the single 2021 peak-cycle STP deal, and it has never been impaired.
The read for TOWR's own minorities
The reason this record matters beyond capital allocation is that it is the best available evidence of how the Hartono family behaves when it controls a listed company and sets the terms for everyone else — and TOWR is itself a listed company with a public float of roughly 35% sitting behind a 65.24% controller (Control and Capital). If the family ever moved to take TOWR private, the same OJK machinery would apply in reverse: a mandatory tender offer to the minority float at a regulated price, which in Indonesia references recent trading levels. At a depressed ~6x multiple, that regulated price would anchor near the current market, not far above it.
The precedent cuts in a specific direction. Across three deals the controller paid the OJK floor and no more — it declined to sweeten the Remala offer when minorities balked, reaching for a private option instead. The setup is two-sided. A family take-private is a live tail possibility: the owner controls 65%, the stock trades at roughly a third of its own historical multiple, and the family has just demonstrated appetite to put fresh capital into the structure. But the same record argues that any such offer would land at the regulated floor, not a rich premium — the OJK reference price tracks recent trading levels, which are themselves depressed.
The strongest fact against reading a take-private into the setup runs the other way entirely. The family's most recent action was not extraction but injection. The Hartono family funded roughly 98% of TOWR's Rp5.5 trillion rights issue at Rp680 a share — above today's Rp414 — while, through its own bank BCA, sitting on the other side of about 9% of the company's debt: the controller is at once its largest owner and a meaningful lender to it. That is fresh capital added to the company rather than the company taken off the market (Control and Capital). And there is no delisting or suspension of TOWR on the record: the company states plainly that there were none through end-2024 [21]. What would change the read is concrete and observable: an RUPS agenda or OJK filing proposing a voluntary tender or delisting of TOWR, or a goodwill impairment that would concede the 2021 STP price as overpaid. Absent those, the acquisition playbook reads as disciplined roll-up by a controller who follows the rules and rarely overpays — after 2021.
Scenarios and Watch Items
The eight chapters before this one leave a stock that is cheap — about six times earnings, roughly 40% below its own history — for reasons that are real: flat per-share earnings, three carriers supplying 87% of revenue, and a balance sheet that refinances rather than repays. The debate between a permanent derating and a mispricing does not resolve by argument. It resolves along a short list of line items that will print in the next few filings. This chapter sets out the scenarios those line items span, and the thresholds that move the read.
How the pieces fit
Every leg of the report attaches to one shared fact and two honest readings of it. The bull and the bear are not looking at different companies; they are weighting the same audited numbers differently. The table below is the reconciliation — each row a number or filing item the earlier chapters established, the two readings it supports, and the evidence that would tip it.
Sources: FY2025 Annual Report — Financial Highlights and Key Ratios [1]; customer-concentration note [2]; Q1 FY2026 maturity profile [3]; as reconciled across Valuation Gap, Colocation Engine and Debt Durability.
The rows are not independent. The tower-revenue line (Colocation Engine), the customer concentration (Carrier Consolidation) and the EPS ceiling (Financials and Estimates) are the same story seen from three angles: a landlord whose demand comes from a buyer base that just shrank from four carriers to three. The balance-sheet and control rows sit underneath as the margin-of-safety question — whether a slow-growing asset can be owned without bankruptcy risk while the operating debate plays out.
Three scenarios
The scenarios below are illustrative combinations of an earnings assumption and a multiple, not forecasts. They exist to show the range the shared facts span and what has to be true for each. Current price is Rp414; FY2025 basic EPS was Rp69, held flat since 2021 [4].
Source: implied prices derived by the author from FY2025 EPS of Rp69 [5], consensus FY2027 EPS of ~Rp72, and multiples spanning the historical range documented in Valuation Gap; current price Rp414 per the price feed.
Source: derived as above; the Rp414 reference is the 23 July 2026 close.
The base and bull cases do not require the tower business to re-accelerate. They rest on two mechanical levers the report already identified. Deleveraging shifts enterprise value from lenders to shareholders: as net debt falls at a roughly constant EV/EBITDA multiple, more of the same enterprise value lands on the equity. And falling finance cost — net finance cost absorbed 41% of operating profit in FY2025 (Financials and Estimates) — flows to the bottom line as the debt reprices; management cut the average borrowing cost to 6.0% from 6.5% over 2025 on Bank Indonesia rate cuts [6]. Consensus, a "Strong Buy" from 13 analysts with a mean target of about Rp685, is a base-to-bull outcome: roughly ten times forward earnings, a re-rating to TOWR's own average rather than a growth story.
Management's own framing is more restrained than the sell-side. For 2026 it guides to "low single-digit" revenue, EBITDA and net-profit growth, with towers "flat for now" and the incremental growth coming from fibre and connectivity as XLSmart integrates [7]. That guidance is the base case in operating terms: it neither confirms the bear's step-down nor the bull's re-acceleration, and management flagged "a lot of noise" in the 2026 outlook it intended to update at the next result [8].
The sell-side range itself frames the downside. The 13-analyst spread runs from a Rp390 low to a Rp950 high around the Rp685 mean; even the most bearish target sits only about 6% below today's price. That does not make the floor safe — targets are not floors — but it is consistent with a market that has already discounted the concentration and consolidation warnings rather than one still waking up to them.
The bankruptcy question
For an investor who wants the chance of a wipeout near zero, the balance sheet is the scenario that matters most, because it is the one that does not mean-revert. The honest reconciliation is that TOWR is refinancing-dependent but not fragile. About Rp15.5tn of principal — roughly 35% of gross debt — falls due within twelve months against only Rp2.27tn of cash and perhaps Rp3tn of annual equity free cash flow, so the group cannot retire its debt from internal cash flow (Debt Durability) [9].
Against that, the credit is investment-grade and structurally cushioned: net debt/EBITDA of 3.74x, interest cover of 3.9x, ratings affirmed in 2025 (S&P BBB-, Fitch BBB and AAA on the national scale), largely unsecured corporate facilities across more than ten lenders, auto-renewing revolvers, and a controlling family that both backstops the equity and — through BCA — sits on one side of about Rp4tn of the debt [10]. The realistic tail risk is not an operating collapse — 82% EBITDA margins on contracted revenue do not evaporate — but a frozen Indonesian credit market during a maturity roll. The mitigant a skeptic should still weigh is that TOWR discloses only that its covenants (a DSCR and a net-debt-to-running-EBITDA test) are met, not the thresholds, so the distance to a breach is not visible from the filings, and bank debt already crept back from Rp43.4tn to Rp44.7tn in Q1 2026 on debt-funded acquisitions [11].
On the evidence, bankruptcy risk in normal markets is low but not negligible, and it is a liquidity risk — the ability to roll maturities — not a solvency or earnings risk. The condition that would raise it is a rating downgrade below investment grade or a covenant threshold coming into view; the condition that would lower it is the net-debt path resuming its decline without fresh debt-funded M&A.
What to watch
The scenarios collapse to a handful of falsifiable line items. Each appears in a specific, recurring filing, and each has a threshold that would move the read one way or the other. The nearest is the next result: management promised to refresh the 2026 outlook, and Q2 FY2026 earnings are due 30 July 2026.
Sources: tenancy and segment economics, FY2025 Annual Report operational review [12]; peer tenancy, Tower Bersama FY2025 Annual Report [13]; goodwill impairment key audit matter [14]; related-party note [15].
Two of these carry more weight than the others for this asset. The tower-leasing gross-profit line is the cleanest read on whether the collocation engine is dormant or broken: it grew 0.8% in 2025 while lower-margin fibre grew 14%, so the number that would change the operating thesis is that tower line turning up on real tenants rather than reclassification [16]. And the goodwill test is the accounting item a skeptic watches first: a value-in-use test that clears every year while the public multiple has halved is a soft check, and any impairment would confirm the market's read over management's [17].
Where the evidence leaves it
The report does not resolve the derating-versus-mispricing question, and the honest reason is that the deciding facts have not printed yet. What it does establish is the shape of the bet. The downside is bounded by an 82%-margin, contracted-revenue asset that generates a low-teens equity free-cash-flow yield after paying its lenders, is deleveraging with the controlling family adding capital above the market price, and carries a rating that has been affirmed through the derating — the margin of safety is real, and the bankruptcy path runs through liquidity, not earnings. The upside is a re-rating to a normal multiple, which two mechanical levers deliver without revenue growth, plus the free option on a tenancy recovery that today's price pays nothing for.
The strongest fact against the constructive read is the one the bears own outright: a landlord that cannot grow per-share earnings, depends on three buyers for 87% of revenue, and saw its one growing tower metric slow to 0.8% has earned a cheaper multiple than a compounder. What would decide it is narrow and, as the watch list shows, checkable in the next few filings — whether the tower line stabilises and whether the falling finance cost finally lets EPS break the ceiling it has held for five years. If both turn, the consensus re-rating needs no growth story; if the tower line steps down instead, roughly six times earnings is close to the fair price rather than a discount to it.